. . . PENNIES for the AGES . . .
170 likes | 326 Vues
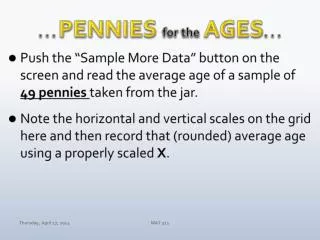
. . . PENNIES for the AGES. Push the “Sample More Data” button on the screen and read the average age of a sample of 9 pennies taken from the jar. Note the horizontal and vertical scales on the grid here and then record that (rounded) average age using a properly scaled X.

. . . PENNIES for the AGES . . .
E N D
Presentation Transcript
. . . PENNIES for theAGES. . . • Push the “Sample More Data” button on the screen and read the average age of a sample of 9 pennies taken from the jar. • Note the horizontal and vertical scales on the grid here and then record that (rounded) average age using a properly scaled X. MAT 312
Suppose the Kick-a-Poo Milling Company made this claim about their Raisin Bran: In our 20-ounce box of raisin bran, we average 143 raisins per box. Now suppose you just opened a 20-ounce box of Kick-a-Poo Raisin Bran and accurately counted 174 raisins. Would this number of raisins be a rare occurrence? Would it seem unusual to you? Write a sentence to explain your response. MAT 312
Prob & Stat (MAT 312)Dr. Day Tuesday February 18, 2014 • Grab 9 Pennies at Random then Calculateand Plot Their Average Age • Return Quiz #2 and Assignment #3 • Measures of Spread • Deviations from Center • Mean Absolute Deviation • Standard Deviation and Variance • Characteristics of a Normal Distribution • Mean and Standard Deviation • Empirical Rule • Putting it all Together: Characteristics of 1-Variable Data • Location, Spread, Shape • Quiz #3 and Test #1 Discussion MAT 312
Which school had the better test scores? Scores from a common test given to 10 students at each of two schools. MAT 312
Assignments • Return Quiz #2 and Assignment #3 with Comments • Quiz #3 (Test #1 prep) today! • Test #1: Thursday, Feb 20: 1-Variable Data Analysis (Chs 1-3) • All material through today’s class • Website Resources • Two parts to the test • Multiple Choice • Open Response MAT 312
Initial Steps: 1-Variable Data Analysis • Clustersare isolated groups of points. • Gaps are large spaces between data points or between clusters of data points. • Outliers are data values substantially larger or smaller than any other data points. • The maximum value of a data set is the largest value in the set. It is also called the upper extreme. • The minimum value of a data set is the smallest value in the set. It is also called the lower extreme. • The range of a data set is the difference between the maximum and minimum values of a data set. • The mode of a data set is the value that occurs most often in the data set. A data set can have more than one mode, and if no data value occurs more often than any other, there is no mode. MAT 312
Representing Data MAT 312