Download
1 / 69
690 likes | 858 Vues
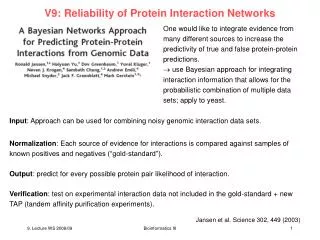
Software for Protein Structures by NMR. Software Can be Grouped into Two General Classes: Protein Based Programs: Calculate Protein Structures XPLOR (NIH, CNS,CXS), CYANA , CHARMM, Sybyl, Amber, etc. Visualize Protein Structures

E N D
Software for Protein Structures by NMR • Software Can be Grouped into Two General Classes: • Protein Based Programs: • Calculate Protein Structures • XPLOR (NIH, CNS,CXS), CYANA, CHARMM, Sybyl, Amber, etc. • Visualize Protein Structures • Quanta, Insight II, VMD-XPLOR, RasMol, Chimera,MOLMOL, PyMOL, MolScript, Swis-PDBViewer, Jmol, etc • Evaluate Protein Structures • PROCHECK, MOLProbity, PROSA, WHATIF, Verify3D, iCING, PSVS, VADAR, etc • NMR Based Programs • NMR data processing • NMRPipe, ACD/NMR, Felix • NMR data analysis/visualization • NMRDraw, NMRViewJ, PIPP, SPARKY, XEASY, CCPN-NMR • Iterative Relaxation Matrix Calculations • IRMA, CORMA, MARDIGRAS, XPLOR, MORASS, etc • Automated NMR Analysis • AutoAssign, AutoStructure,ARIA, PINE, CANDID/UNIO,CS-ROSETTA, we-nmr, I-TASSER, etc • Not A complete List of Software • New software is constantly being developed • In a practical, sense, only use a small subset of available software • a lot of redundancy, use what trained on/comfortable with. • No Real Standards • different file formats, a lot of incompatibilities and file manipulations necessary.
Software for Protein Structures by NMR • Protein NMR Based Software Programs: • There are multiple programs that have similar functions. • Not practical or necessary to discuss all the variety of programs that are available. • Applications will be discussed in general with specific references to a limited number • of programs. • Protein Based Programs:Visualize Protein Structures • How is the protein structure stored? • No uniform format. • Protein Data Bank (PDB) is the closest thing to a uniformed format • Most programs can read and/or write PDB file formats • Just about every program has its own proprietary format • Babel program can interconvert ~47 different structure formats • Common Information in a protein structure: • atoms, residues, chains • X, Y, Z coordinates
Software for Protein Structures by NMR • Protein Based Programs:Visualize Protein Structures • Protein Data Bank (PDB) format: • Header: Protein Name Unique PDB Identifier Submission Date HEADER DNA BINDING PROTEIN 08-SEP-01 1JXS TITLE SOLUTION STRUCTURE OF THE DNA-BINDING DOMAIN OF INTERLEUKIN TITLE 2 ENHANCER BINDING FACTOR COMPND MOL_ID: 1; COMPND 2 MOLECULE: INTERLEUKIN ENHANCER BINDING FACTOR; COMPND 3 CHAIN: A; COMPND 4 FRAGMENT: DNA-BINDING DOMAIN; COMPND 5 SYNONYM: ILF-1; COMPND 6 ENGINEERED: YES SOURCE MOL_ID: 1; SOURCE 2 ORGANISM_SCIENTIFIC: HOMO SAPIENS; SOURCE 3 ORGANISM_COMMON: HUMAN; SOURCE 4 GENE: ILF-1; SOURCE 5 EXPRESSION_SYSTEM: ESCHERICHIA COLI; SOURCE 6 EXPRESSION_SYSTEM_COMMON: BACTERIA; SOURCE 7 EXPRESSION_SYSTEM_STRAIN: BL21; SOURCE 8 EXPRESSION_SYSTEM_VECTOR_TYPE: PLASMID; SOURCE 9 EXPRESSION_SYSTEM_PLASMID: PET21A KEYWDS DNA-BINDING DOMAIN, WINGED HELIX EXPDTA NMR, 20 STRUCTURES AUTHOR W.J.CHUANG,P.P.LIU,C.LI,Y.H.HSIEH,S.W.CHEN,S.H.CHEN,W.Y.JENG REVDAT 1 11-MAR-03 1JXS 0 JRNL AUTH P.P.LIU,Y.C.CHEN,C.LI,Y.H.HSIEH,S.W.CHEN,S.H.CHEN, JRNL AUTH 2 W.Y.JENG,W.J.CHUANG JRNL TITL SOLUTION STRUCTURE OF THE DNA-BINDING DOMAIN OF JRNL TITL 2 INTERLEUKIN ENHANCER BINDING FACTOR 1 (FOXK1A) JRNL REF PROTEINS: V. 49 543 2002 JRNL REF 2 STRUCT.,FUNCT.,GENET. Descriptive Title of Structure All Compounds Present Source of Sample Authors Publication Information
Software for Protein Structures by NMR • Protein Based Programs:Visualize Protein Structures • Protein Data Bank (PDB) format: • Header: REMARK 210 EXPERIMENTAL DETAILS REMARK 210 EXPERIMENT TYPE : NMR REMARK 210 TEMPERATURE (KELVIN) : 300; 300; 300; 300 REMARK 210 PH : 6; 6; 6; 6 REMARK 210 IONIC STRENGTH : 125; 125; 125; 125 REMARK 210 PRESSURE : AMBIENT; AMBIENT; AMBIENT; REMARK 210 AMBIENT REMARK 210 SAMPLE CONTENTS : 3MM ILF, 25MM PHOSPHATE REMARK 210 BUFFER, 100MM NACL; 3MM ILF, REMARK 210 25MM PHOSPHATE BUFFER, 100MM REMARK 210 NACL; 3MM ILF U-15N, 25MM REMARK 210 PHOSPHATE BUFFER, 100MM NACL; REMARK 210 2MM ILF U-15N, 13C, 25MM REMARK 210 PHOSPHATE BUFFER, 100MM NACL REMARK 210 REMARK 210 NMR EXPERIMENTS CONDUCTED : NOESY, DQF-COSY, TOCSY, 3D_ REMARK 210 15N-SEPARATED_NOESY, 3D_13C- REMARK 210 SEPARATED_NOESY REMARK 210 SPECTROMETER FIELD STRENGTH : 600 MHZ, 500 MHZ REMARK 210 SPECTROMETER MODEL : AVANCE, DMX REMARK 210 SPECTROMETER MANUFACTURER : BRUKER REMARK 210 REMARK 210 STRUCTURE DETERMINATION. REMARK 210 SOFTWARE USED : AURELIA 2.7.10, XWINNMR 2.6 REMARK 210 METHOD USED : HYBRID DISTANCE GEOMETRY- REMARK 210 HBHA(CBCACO)NH Description of Experimental Data . . .
Software for Protein Structures by NMR • Protein Based Programs:Visualize Protein Structures • Protein Data Bank (PDB) format: • Header: REMARK 900 RELATED ENTRIES REMARK 900 RELATED ID: 4829 RELATED DB: BMRB REMARK 900 1H, 15N AND 13C RESONANCE ASSIGNMENTS FOR THE DNA-BINDING REMARK 900 DOMAIN OF INTERLEUKIN ENHANCER BINDING FACTOR DBREF 1JXS A 1 98 SWS Q01167 ILF1_HUMAN 251 348 SEQRES 1 A 98 ASP SER LYS PRO PRO TYR SER TYR ALA GLN LEU ILE VAL SEQRES 2 A 98 GLN ALA ILE THR MET ALA PRO ASP LYS GLN LEU THR LEU SEQRES 3 A 98 ASN GLY ILE TYR THR HIS ILE THR LYS ASN TYR PRO TYR SEQRES 4 A 98 TYR ARG THR ALA ASP LYS GLY TRP GLN ASN SER ILE ARG SEQRES 5 A 98 HIS ASN LEU SER LEU ASN ARG TYR PHE ILE LYS VAL PRO SEQRES 6 A 98 ARG SER GLN GLU GLU PRO GLY LYS GLY SER PHE TRP ARG SEQRES 7 A 98 ILE ASP PRO ALA SER GLU SER LYS LEU ILE GLU GLN ALA SEQRES 8 A 98 PHE ARG LYS ARG ARG PRO ARG HELIX 1 1 ALA A 9 MET A 18 1 10 HELIX 2 2 THR A 25 TYR A 37 1 13 HELIX 3 3 TRP A 47 ASN A 58 1 12 HELIX 4 4 SER A 83 ARG A 93 1 11 SHEET 1 A 3 GLN A 23 LEU A 24 0 SHEET 2 A 3 PHE A 76 ILE A 79 -1 O TRP A 77 N LEU A 24 SHEET 3 A 3 PHE A 61 VAL A 64 -1 N VAL A 64 O PHE A 76 CRYST1 1.000 1.000 1.000 90.00 90.00 90.00 P 1 1 ORIGX1 1.000000 0.000000 0.000000 0.00000 ORIGX2 0.000000 1.000000 0.000000 0.00000 ORIGX3 0.000000 0.000000 1.000000 0.00000 SCALE1 1.000000 0.000000 0.000000 0.00000 Reference to Data in other Databases Protein Sequence Observed Secondary Structure Elements Meaningless symmetry data (consistency with X-ray structures) . . .
Software for Protein Structures by NMR • Protein Based Programs:Visualize Protein Structures • Protein Data Bank (PDB) format: • Coordinates: Atom Type Residue Type Temperature Factor Atom No. Occupancy Residue No. Model Number (NMR structures typically Will have multiple models in a single PDB file Atom Identifier . . . X, Y, Z coordinates Chain (structures composed of multiple proteins will have a different chain for each protein) Identifier (4 characters)
Software for Protein Structures by NMR • Protein Based Programs:Visualize Protein Structures • Protein Data Bank (PDB) format: • Coordinates: • Other Features End of Model . . . End of File HETATM Identifier (non-protein atoms Small molecules, ions, solvent, water etc) Define Specific Atom Connectivity N-Terminal NH (NH3 instead of NH) C-Terminal O (sometimes OXT1 & OXT2)
Software for Protein Structures by NMR Y Protein A X Z Protein B • Protein Based Programs:Visualize Protein Structures • Protein Data Bank (PDB) format: • Coordinates • Are internally consistent: i.e. the X,Y,Z coordinates of atom A is the appropriate bond distance away from the X,Y,Z coordinates of atom B. • The coordinates on an absolute scale are arbitrary: i.e. there is no defined relationship between the coordinates of protein A and protein B, even if protein A and protein B are multiple copies of the same protein. • Alignment Issue • Proteins need to be aligned for any structural comparison • After alignment, can visually compare relative orientation/position of secondary structures, active-sites, bound ligands, position of side-chains, etc • After alignment, relative distance comparisons have meaning i.e. if 2 helix do not overlap perfectly a measured displacement of the helices is relevant • Alignment requires both rotational and translational transformation of one coordinate axis relative to the other. • one protein is remained fixed and the other protein(s) are aligned to it Y Protein A Relative position of the 2 proteins in the X,Y,Z coordinate system is arbitrary. Align The 2 proteins are now centered in the same coordinate frame. Protein B X Z
Software for Protein Structures by NMR • Protein Based Programs:Visualize Protein Structures • Different Ways to Visualize the Same Protein Structure • Lines/Sticks • Connect each atom coordinate position by a straight line • Bond colored by atom type where ½ of bond corresponds to atom 1 and the other ½ to atom 2 • Accurate representation of atom position • Poor representation of protein packing • Crowded • Reduce complexity by only displaying backbone or specific regions • Reduce complexity by zooming in on particular region
Software for Protein Structures by NMR • Protein Based Programs:Visualize Protein Structures • Different Ways to Visualize the Same Protein Structure • Ball+Stick • Connect each atom coordinate position by a straight line • Display each atom as a sphere • Accurate representation of atom position • poor representation of protein packing • Crowded • Reduce complexity by only displaying backbone or specific regions • Reduce complexity by zooming in on particular region
Software for Protein Structures by NMR • Protein Based Programs:Visualize Protein Structures • Different Ways to Visualize the Same Protein Structure • Ribbons/Cartoon • Connect each Ca atom coordinate position by a graphical representation • Smooth-Fit of Ca positions • Not accurate representation of atom coordinates • Reduces Complexity of View No Side-chains, usually only backbone • Highlights secondary structure • b-strands typically shown as arrow pointing in direction of C-terminus • a-helix shown as a thick helical coil • random coil regions shown as tube • Highlights Overall fold and topology • Easy Comparison of Fold Families
Software for Protein Structures by NMR • Protein Based Programs:Visualize Protein Structures • Different Ways to Visualize the Same Protein Structure • Space Filling/van der Waals • Each atom position represented by a sphere • diameter of sphere is equal to van der Waals radius • very accurate representation of protein • Highlights surface structure • identify binding pockets • can not visualize interior of protein without slicing through structure • Highlights packing • verify absence of “holes” in structure • verify tight packing of different domains, small molecule in binding pocket, etc Colored coded by domain Space Filling emphasizes hole or channel in protein van der Waals radii (in Å)
Software for Protein Structures by NMR • Protein Based Programs:Visualize Protein Structures • Different Ways to Visualize the Same Protein Structure • GRASP • Generates a smooth topology or shape of the protein’s surface • Highlights detailed surface structure • identify binding pockets • can not visualize interior of protein without slicing through structure • Can Map properties of the protein onto the surface • electrostatic • NMR chemical shift changes • NMR Dynamics & X-ray B-factors • Conserved Residues from Sequence Alignment GRASP surface of acetyl choline esterase complexed with acetyl choline colored by potential (red negative, blue positive) GRASP surface of MMP-1 displaying NMR chemical shift changes upon binding an inhibitor
Software for Protein Structures by NMR • Protein Based Programs:Evaluate Protein Structures • Compare to known Structures • All Structures have Problems or Errors as determined by software analysis • The challenge is to determine which, if any, errors are serious misinterpretation of the data and require correcting. • Three general rules of thumb • If the error is sever, far outside the norm, it is probably a mistake. • If errors cluster together, there is almost certainly a mistake. • If the structure has an odd conformation: • knot, large holes, p-helix, +f for non-Gly, etc. Remember: The comparison is made against typical structures, your “error” may simply represent a novel fold or conformation that has not been seen. Let the Data Determine the Structure
Software for Protein Structures by NMR • Protein Based Programs:Evaluate Protein Structures • Compare a new protein structure against standard parameters or values • standard values or trends are ascertained from analysis of high quality, high resolution structures in the PDB • typical features as we discussed in the introduction to protein structures • PROCHECK • A common program used by PDB to validate deposited structures • Assesses the "stereochemical quality" of a given protein structure • reads a PDB formatted file • generates 10 output postscript files • analyzes f, y, c1,c2 torsion angles, bond lengths bond angles • analyzes “bad contacts” atoms too close by van derwaals radius • analyzes hydrogen bond energy • analyzes G-factor • Provides overall and per residue analyses • Identifies distorted geometry • To run the program: • procheckfilename [chain] resolution • where filename = the coordinates file in Brookhaven format [chain] = an optional one-letter chain-ID resolution = a real number giving the resolution of the structure • Compares bond lengths and bond angles to database of standard small molecule values
Software for Protein Structures by NMR • Protein Based Programs:Evaluate Protein Structures • PROCHECK • correctf, y distribution • most residues should fall in the most favored region of Ramachandran plot Red contours indicate preferred region of the Ramachandran plot Colored contours indicate allowed regions of the Ramachandran plot
Software for Protein Structures by NMR • Protein Based Programs:Evaluate Protein Structures • PROCHECK • correctf, y, c1,c2 distribution as a function of residue type • most residues should fall in the preferred region of the Ramachandran plots Dark contours are preferred regions
Software for Protein Structures by NMR • Protein Based Programs:Evaluate Protein Structures • PROCHECK • comparison of main chain parameters to standard values of comparable X-ray structures • consistent or better results with a comparable resolution structure implies a reliable structure Value observed for structure at specified resolution. Inside band indicates it is consistent with other similar resolution structures Boxed Plot is Overall G-factor or Structure Quality Score Band indicates range of values observed as a function X-ray resolution
Software for Protein Structures by NMR • Protein Based Programs:Evaluate Protein Structures • PROCHECK • comparison of side chain parameters to standard values of comparable X-ray structures • consistent or better results with a comparable resolution structure implies a reliable structure Value observed for structure at specified resolution. Inside band indicates it is consistent with other similar resolution structures Band indicates range of values observed as a function X-ray resolution
Software for Protein Structures by NMR • Protein Based Programs:Evaluate Protein Structures • PROCHECK • Complete list of structure violations • Per residue plot of main chain and side-chain parameters • Number of plots of statically summaries of parameters
Software for Protein Structures by NMR • Protein Based Programs:Evaluate Protein Structures • MOLPROBITY • Provides a variety of protein structure checks by comparison to standard values in PDB • Some overlap with Procheck • Some unique checks including clashes and structure visualization * 100th percentile is the best among structures of comparable resolution; 0th percentile is the worst.
Software for Protein Structures by NMR • Protein Based Programs:Evaluate Protein Structures • MOLPROBITY • Multi-criterion chart • per residue analysis of all problems
Software for Protein Structures by NMR • Protein Based Programs:Evaluate Protein Structures • MOLPROBITY • Multi-criterion kinemage • view all problems Bad rotamer Bad backbone conformation Choose what to display Bad clash
Software for Protein Structures by NMR • Protein Based Programs:Evaluate Protein Structures • MOLPROBITY • Single-criterion files • view all problems: • Clash list • Ramachandran plot kinemage • Ramachandran plot PDF • Cβ deviation scatter plot Clash List Atom PairDistance
Software for Protein Structures by NMR • Protein Based Programs:Evaluate Protein Structures • MOLPROBITY • Single-criterion files
Software for Protein Structures by NMR • Protein Based Programs:Evaluate Protein Structures • MOLPROBITY • Single-criterion files • view all problems: • Cβ deviation scatter plot
Software for Protein Structures by NMR Area Buried (Å2) 0 120 40 80 E P2 0.80 B3 P1 B2 0.40 Fraction Polar B1 0.00 Total 3D-1D score = • Protein Based Programs:Evaluate Protein Structures • Verify3D • Compares the primary sequence against the protein’s 3D structure • Compares each residues position to statistical distribution of the 20 amino acids against defined structural environments. • based on the total area buried and fraction of side-chain area covered by polar atoms Structure Environments
Software for Protein Structures by NMR Buried Hydrophobic Environment Exposed Hydrophilic Environment 3D-1D Scoring Table
Software for Protein Structures by NMR • Protein Based Programs:Evaluate Protein Structures • Verify3D • Example scoring function on a per residue basis Actual X-ray structure Incorrect modeled structure
Software for Protein Structures by NMR • Protein Based Programs:Evaluate Protein Structures • ProSA-Web • Overall model quality (Z-score) • compare to typical range for known NMR and X-ray structures • calculate energy for all Ca-Ca or Cb-Cb interactions • generate collection of decoy folds (50,0000) by using database of sequence/structure fragments • thus, correct fold will have low energy & low Z-score relative to decoy structures • length dependent Z = Xi – X s Protein analyzed
Software for Protein Structures by NMR • Protein Based Programs:Evaluate Protein Structures • ProSA-Web • Model energy as a function of amino acid seqeunce • positive values correspond to problematic regions • single-value has large fluctuation and is of little value • averaged over a window of 40 (dark) and 10 (light) residues Visualize the per residue energy on the structure (identify problematic regions) Reliable Structure (no strain energy)
Software for Protein Structures by NMR • Protein Based Programs:Evaluate Protein Structures • WHATIF/WHATCHECK • Provides a variety of protein structure checks by comparison to standard values in PDB • Some overlap with Procheck • Some unique checks including packing parameters • Unique to WHATIF/WHATCHECK • Check for buried unsatisfied h-bond donors and acceptors • Peptide bond flip check • Check for amino-acid handedness • HIS GLN ASN side chain conformation check • Check for atom nomenclature • Side chain planarity check • Verification of Proline puckering • New Directional atomic contact analysis • Directional atomic contact analysis • Particular to X-ray Structures • Check for isolated water clusters • Atomic occupancy check • Symmetry check • Chain Name Validation • Similar to Procheck • Verification of bond lengths • Check for bumps (bad contacts) • Amino-acid side chain rotamer analysis • Torsion angle evaluation
Software for Protein Structures by NMR • Protein Based Programs:Evaluate Protein Structures • WHATIF/WHATCHECH Protein Packing Report: Warning: Low packing Z-score for some residues The residues listed in the table below have an unusual packing environment according to the 2nd generation quality check. The score listed in the table is a packing normality Z-score: positive means better than average, negative means worse than average. Only residues scoring less than -2.50 are listed here. These are the "unusual" residues in the structure, so it will be interesting to take a special look at them. 137 LYS ( 10 ) B -3.43 136 LYS ( 9 ) B -3.11 30 GLN ( 40 ) A -3.08 218 GLU ( 91 ) B -2.84 158 VAL ( 31 ) B -2.83 240 LYS ( 113 ) B -2.59 231 GLU ( 104 ) B -2.52 Warning: Abnormal packing Z-score for sequential residues A stretch of at least four sequential residues with a 2nd generation packing Z-score below -1.75 was found. This could indicate that these residues are part of a strange loop or that the residues in this range are incomplete, but it might also be an indication of mis-threading. The table below lists the first and last residue in each stretch found, as well as the average residue Z-score of the series. 134 ASN ( 7 ) B --- 137 LYS ( 10 ) B -2.65 Warning: Structural average packing Z-score a bit worrisome The structural 2nd generation average quality control value is a bit low. The protein is probably threaded correctly, but either poorly refined, or it is just a protein with an unusual (but correct) structure. The average quality of properly refined X-ray structures is 0.0+/-1.0. All contacts : Average = -0.589 Z-score = -3.74 BB-BB contacts : Average = -0.178 Z-score = -1.27 BB-SC contacts : Average = -0.574 Z-score = -3.07 SC-BB contacts : Average = -0.240 Z-score = -1.29 SC-SC contacts : Average = -0.563 Z-score = -2.79
Software for Protein Structures by NMR • Protein Based Programs:Evaluate Protein Structures • WHATIF/WHATCHECH Packing Score • For each "fixed fragment" in a protein structure (any "largest group" of atoms that does not contain a torsion angle): • the occurrence of all possible atom types in all possible positions around the fixed fragment is counted. • If a certain configuration occurs very frequently, it is assumed to be a preferred configuration. • All preference counts for all atoms around a residue are used to calculate a summary score for each residue. • Quality control score for each residue is a Z-score • Describes how well this residue feels compared to other similar residues in well refined structures. • If the residue Z-score is negative, it feels less at home than the "average" residue. • If the Z-score is positive, it feels more at home than average. • The individual scores are not very powerful. • A lot of structures have a few low-scoring residues. • More useful are: • list of sequential residues that all have low scores (possibly indicating a mis-threaded segment), • overall quality control Z-score • Impact on modeling by homology: • Severe. • If a structure has a bad quality control Z-score, it can not be trusted. • Impact for NMR and crystallographer: • Global quality control value should only be low for a really misthreaded or improperly folded structure. • Individual residues listed are not really rare. • The most interesting is the "residues in sequence" • if that table shows any entries, have a look whether there is an alternative for the conformation of that "loop".
Software for Protein Structures by NMR • Protein Based Programs:Evaluate Protein Structures • WHATIF/WHATCHECH Buried hydrogen bond donors and acceptors are not involved in a hydrogen bond The pairs of atoms listed have an unusually short distance. 9 GLY ( 19 ) A N 11 TYR ( 21 ) A N 15 ILE ( 25 ) A O 29 ASP ( 39 ) A O 30 GLN ( 40 ) A O 31 HIS ( 41 ) A ND1 32 ILE ( 42 ) A N 33 GLN ( 43 ) A N 39 GLU ( 49 ) A O 48 SER ( 58 ) A O 60 ASP ( 70 ) A N 62 LEU ( 72 ) A N 74 LEU ( 84 ) A N 81 GLU ( 91 ) A O 84 TYR ( 94 ) A N 92 HIS ( 102 ) A NE2 101 LEU ( 111 ) A O 45 TYR ( 55) A CZ -- 74 LEU ( 84) A CD1 0.479 2.721 INTRA 78 ARG ( 88) A CD -- 86 THR ( 96) A CG2 0.391 2.809 INTRA 109 LEU ( 119) A O -- 110 GLY ( 120) A C 0.375 2.425 INTRA 110 GLY ( 120) A N -- 111 PRO ( 121) A CD 0.365 2.635 INTRA 131 PRO ( 4) B O -- 133 GLY ( 6) B N 0.358 2.192 INTRA BF 39 GLU ( 49) A O -- 40 SER ( 50) A CB 0.349 2.451 INTRA 109 LEU ( 119) A C -- 111 PRO ( 121) A CD 0.340 2.860 INTRA 163 ASP ( 36) B O -- 165 SER ( 38) B N 0.328 2.372 INTRA 114 HIS ( 124) A O -- 115 PHE ( 125) A C 0.328 2.472 INTRA 165 SER ( 38) B O -- 166 ASP ( 39) B C 0.303 2.497 INTRA 98 PHE ( 108) A CB -- 120 ILE ( 130) A CG1 0.297 2.903 INTRA 132 LEU ( 5) B O -- 133 GLY ( 6) B C 0.296 2.504 INTRA BF 246 LEU ( 119) B O -- 247 GLY ( 120) B C 0.295 2.505 INTRA 113 THR ( 123) A CB -- 120 ILE ( 130) A CD1 0.286 2.914 INTRA 131 PRO ( 4) B O -- 132 LEU ( 5) B C 0.282 2.518 INTRA BF 151 ARG ( 24) B NH1 -- 153 LEU ( 26) B CD2 0.278 2.822 INTRA 81 GLU ( 91) A C -- 83 GLY ( 93) A N 0.277 2.623 INTRA 96 HIS ( 106) A CD2 -- 216 LEU ( 89) B CD2 0.255 2.945 INTRA . . . . . .
Software for Protein Structures by NMR • Protein Based Programs:Calculate Protein Structures • Comparison of XPLOR and CYANA • XPLOR • Also known as XPLOR-NIH, CNS and CNX • Calculates structures using Cartesian coordinates • Uses a modified PDB file format • Optimizes • Number of specific “Target Functions” to refine protein structure • 1H -1H distance (NOEs) • Chemical shifts (both 13C & 1H) • Coupling constants (3JNHCa) • Ramachandran database • Empirical Backbone-Backbone Hydrogen-Bonding Potential • Radius of Gyration • Residual Dipolar Coupling Constants • CYANA • Dynamics geometry Algorithm for NMR Applications • Calculates structures using Torsional Space • Bond lengths and bond angles are kept fixed only torsion angles are allowed to change • Advantages over XPLOR • Faster • Higher structure conversion rate (~30% for XPLOR) • Disadvantages compared to XPLOR • lacks additional target functions • lower quality structures • artificially sets all parameters except torsion angles to ideal values
Software for Protein Structures by NMR • Protein Based Programs:Calculate Protein Structures • General overview of XPLOR Protein Structure Calculations • First Step is Determining a Molecular Structure File for Your Specific Protein Sequence • Molecular Structure File (PSF) • Contains all the information to describe the connectivity of the protein • Contains atom/residue information (names, types, charges masses, etc.) • Contains structure terms (bond, angle, dihedral, improper, etc.) • Does not contain atomic coordinates! • Information is obtained from two standard databases • Topallhdg_new.pro - connectivity information for each amino acid - need to define topology for ALL non-amino acids • Parallhdg_new.pro - defines expected values for bond lengths, bond angles, etc • PSF patches • define disulphide bonds • define cis peptide bonds • PSF file is required for ALL XPLOR calculations • PSF file must match exactly all the information in the structure or coordinate file (PDB file). • Makes comparison of related, but not identical protein structures very challenging.
Software for Protein Structures by NMR • An Example: You want to compare your NMR structure with an X-ray structure you obtained from the PDB: X-ray structure: - does not contain hydrogens. - There is a loop that doesn’t have coordinates (no electron density) - The structure contains a number of water molecules and detergent molecules - Identifiers are 1PDB, WAT, DET NMR structure: - has a His-tag at the C-terminus (aid in purification) - has three additional residues at the N-terminus (artifact of the cloning process) - the residue numbering start at 1 instead of 185 in the X-ray structure - Identifier is the atom type (C,H,N,O) Your PSF file is consistent with your NMR structure, so XPLOR will give numerous errors when you try to read both the NMR and X-ray coordinate files. What are your options? 1) Make the X-ray coordinate file exactly match the NMR coordinate file: - add hydrogens - add dummy coordinates for the missing loop region - remove all the water molecules and detergent molecules - change identifier 2) Make the NMR coordinate file exactly match the X-ray coordinate file and create a new PSF file consistent with the X-ray structure: - remove hydrogens and extra residues not present in X-ray structure - re-number the residues and atoms - change identifier
Software for Protein Structures by NMR mass H 1.008mass C 12.011mass N 14.007mass O 15.999 residue ALA group atom N type=NH1 charge=-0.36 end atom HN type=H charge= 0.26 end group atom CA type=CT charge= 0.00 end atom HA type=HA charge= 0.10 end group atom CB type=CT charge=-0.30 end atom HB1 type=HA charge= 0.10 end atom HB2 type=HA charge= 0.10 end atom HB3 type=HA charge= 0.10 end group atom C type=C charge= 0.48 end atom O type=O charge=-0.48 end bond N HN bond N CA bond CA HA bond CA CB bond CB HB1 bond CB HB2 bond CB HB3 bond CA C bond C Oimproper HA N C CB !stereo CA improper HB1 HB2 CA HB3 !stereo CBend • Protein Based Programs:Calculate Protein Structures • General overview of XPLOR Protein Structure calculations • Topallhdg_new.pro Partial list of atomic masses Defines and groups all atoms, assigns a type and charge Defines pairs of bonded atoms Defines a group of four atoms comprising an improper torsion angle
Software for Protein Structures by NMR • Protein Based Programs:Calculate Protein Structures • General overview of XPLOR Protein Structure Calculations • Topallhdg_new.pro Atoms defined by an improper angle to maintain proper sterochemistry are boxed. Usually set to either 0o or 180o Atom Types:all atoms that have the same structural properties i.e. same bond lengths, bond angles, dihedrals are classified to the same atom type. Simplifies the assignment of structural parameters while keeping unique atom identifiers. Improper:Artificial dihedral definition used primarily to maintain planer arrangement of atoms or proper stereochemistry in the structure (peptide bond, aromatic rings, etc). Does not follow the linear connectivity of a “proper” dihedral angles. The bond lengths and bond angles for CA-HA, CB-HB1, CB-HB2, and CB-HB3 are identical. So, all defined as CT-HA
Software for Protein Structures by NMR • Protein Based Programs:Calculate Protein Structures • General overview of XPLOR Protein Structure Calculations • Parallhdg_new.pro Force Constant Ideal Value bonds H NA $kbon 0.98 bond CT CT $kbon 1.53 angle HA CT C $kang 109.5angle CA CA CT $kang 120.0 improper H X X C $kpla 0 0.0 improper C X X C $kpla 0 0.0 dihedral CA CA CT CT $kdih 3 0.0 dihedral NA CC CT CT $kdih 3 0.0 NONbonded C 0.0903 3.2072 0.0903 3.2072 NONBonded CA 0.120 3.2072 0.120 3.2072 nbfix H O 44.2 1.0 44.2 1.0 nbfix H OC 44.2 1.0 44.2 1.0 . . List all possible combinations of bonds, angles, impropers and dihedral with ideal values, force constants and multiplicity. . . . . . . Parameterization of van der Waals equation for atom-atom contact. . . Parameterization of hydrogen-bond interactions. multiplicity
Software for Protein Structures by NMR • Protein Based Programs:Calculate Protein Structures • General overview of XPLOR Protein Structure Calculations • Parallhdg_new.pro • Defining atomic parameters is a very active area of molecular modeling research • The values in the parameter database come from multiple sources: • X-ray database of high-resolution small molecules • ab initio calculations • experimental observations, IR, Raman, water-ion neutron and X-ray diffraction data, free energy of solvation data, etc
Protein Structures from an NMR Perspective Distribution of Bond Distances in Protein Hydrogen Bonds
Software for Protein Structures by NMR • Protein Based Programs:Calculate Protein Structures • General overview of XPLOR Protein Structure Calculations • XPLOR PSF Script remarks build psf file rtf @/PROGRAMS/xplor-nih-2.9.1/toppar/topallhdg_new.pro END parameter @/PROGRAMS/xplor-nih-2.9.1/toppar/parallhdg_new.pro END segment name=" " SETUP=TRUE chain LINK PEPP HEAD - * TAIL + PRO END {LINK to PRO } LINK PEPT HEAD - * TAIL + * END FIRSt PROP TAIL + PRO END FIRSt NTER TAIL + * END LAST CTER HEAD - * END sequence MET THR LEU LYS HIS HIS HIS end end end write psf output=PROTEIN.psf end stop Read parameter and topology files: Initiate a segment. Repeat for each individual chain or component of the structure: Definitions in the topology file on how to make a peptide bond and cap the N-terminus and C-terminus : Complete protein sequence: . . Write out the PSF file with name PROTEIN.psf:
Software for Protein Structures by NMR • Protein Based Programs:Calculate Protein Structures • General overview of XPLOR Protein Structure Calculations • XPLOR PSF Script • PATCHES HIS HIS HIS end end end patch CISP reference="-"=(residue 109) reference="+"=(residue 110) end patch DISU reference=1=(residue 29) reference=2=(residue 57) end patch ltod reference=nil=(resid 8) end write psf output=PROTEIN.psf end stop Create a cis peptide bond between residues 109 (P) and 110: Create a disulphide bond between residues 29 and 57: Convert residue 8 to a D-amino acid
Software for Protein Structures by NMR • Protein Based Programs:Calculate Protein Structures • General overview of XPLOR Protein Structure Calculations • XPLOR PSF Script • Using Structures and Multiple Segments rtf @/PROGRAMS/xplor-nih-2.9.1/toppar/topallhdg_new.pro @molecule.top END parameter @/PROGRAMS/xplor-nih-2.9.1/toppar/parallhdg_new.pro @molecule.par END segment name=“PROT" SETUP=TRUE chain LINK PEPP HEAD - * TAIL + PRO END {LINK to PRO } LINK PEPT HEAD - * TAIL + * END coordinates @PROTEIN.pdb end end end segment name=“MOLE " SETUP=TRUE CHAIN sequence CPD end end end write psf output=PROTEIN.psf end stop Read in your parameter and topology files defining molecule: Instead of listing sequence, read in PDB file: Define segment “MOLE” that contains a single copy of molecule (note: no LINK used) :
Software for Protein Structures by NMR • Protein Based Programs:Calculate Protein Structures • General overview of XPLOR Protein Structure Calculations • Second Step is to create a linear extended structure of the protein sequence using idealized geometry • Extended structure coordinate File (EXT) • Standard XPLOR PDB coordinate file • Starting point to generate a proper fold for the protein from experimental data Typical extended structure created by XPLOR based on a PSF file
Software for Protein Structures by NMR • Protein Based Programs:Calculate Protein Structures • General overview of XPLOR Protein Structure Calculations • Third Step is to convert NMR experimental data into XPLOR format • Distance Constraints • a file (noe.tbl) containing a list of all observed/assigned NOE distant constraints a b c assign ( resid 3 and name HB# ) ( resid 49 and name HD# ) 4.0 2.2 3.0 XPLOR assign statement Residue number and atom name for each atom involved in the distance constraint Distance information Understanding the distance information (a b c): - a distance constraint is typically defined with a range as opposed to an absolute number. ■an upper and lower bound - in XPLOR format ■upper bound = a + c in our example: upper bound = 4.0Å + 3.0Å = 7.0Å ■lower bound = a - b in our example: lower bound = 4.0Å – 2.2Å = 1.8Å
Software for Protein Structures by NMR O C CA CB N HB1 HB3 HA HB2 HN • Protein Based Programs:Calculate Protein Structures • General overview of XPLOR Protein Structure Calculations • Distance Constraints • Pseudo-Atoms/Wildcards assign ( resid 3 and name HB# ) ( resid 49 and name HD# ) 4.0 2.2 3.0 What atom is HB# or HD#?: - Recall the PDB atom nomenclature ■each atom gets a unique atom identifier but ■each atom does not have a unique NMR resonance ■a distance constraint to Ala methyl needs to go to HB1, HB2 and HB3. - XPLOR represents these equivalent atoms with a single pseudo atom that is positioned equidistant between them ■in the assign statement the equivalent atoms are represented with a wildcard (# or *) # - represents 1 character i.e. HB# HB1 & HB2 * - represents 2 characters i.e. HD* ■distance constraint is to the pseudo-atom Pseudo-atom (HB#) HD11,HD12,HD13 & HD21,HD22,HD23 2 Leu d methyls
Software for Protein Structures by NMR O C CA CB N HB1 HB3 HA HB2 HN • Protein Based Programs:Calculate Protein Structures • General overview of XPLOR Protein Structure Calculations • Distance Constraints • Pseudo-Atoms/Wildcards assign ( resid 14 and name HD* ) ( resid 97 and name HD* ) 4.0 2.2 5.8 Why Not Just Use Multiple Assign Statements?: - For a distance constraint between two sets of Leu d methyls there would be 36 possible combinations! - Multiple constraints between the same sets of atoms would bias or overemphasize that distance constraints relative to others ■Each constraint would contribute independently to a violation energy that XPLOR attempts to minimize. ■Each duplication of a constraint that is violated would increase the likelihood that that constraint would be satisfied at the expense of other constraints ■ Tipping the balance of energy to favor one constraint- All the hydrogens may not be simultaneously satisfied for any given conformation. ■XPLOR will try to satisfy all the constraints leading to a distorted structure. Pseudo-atom (HB#)