Download

1 / 15
150 likes | 162 Vues
This training course explains the use of control charts for attributes in quality control, including control limits, interpretation of points on the chart, and the choice between attributes and variables control charts. Led by Professor Peter Ping Liu, Ph.D., PE, CQE, OCP, and CSIT, participants will learn how to effectively implement control charts in their processes.

E N D
Goal Sharing Team TrainingStatistical Resource Leaders (3) Peter Ping Liu, Ph D, PE, CQE, OCP and CSIT Professor and Coordinator of Graduate Programs School of Technology Eastern Illinois University Charleston, IL 61920
Introduction • Data that can be classified into one of several categories or classifications is known as attribute data. • Classifications such as conforming and nonconforming are commonly used in quality control.
Control Charts for Fraction Nonconforming • Fraction nonconformingis the ratio of the number of nonconforming items in a population to the total number of items in that population. • Control charts for fraction nonconforming are based on the binomial distribution.
Control Charts for Fraction Nonconforming • If no standard value of p is given, then the control limits for the fraction nonconforming are where
Control Charts for Fraction Nonconforming Trial Control Limits • Control limits that are based on a preliminary set of data can often be referred to as trial control limits. • The quality characteristic is plotted against the trial limits, if any points plot out of control, assignable causes should be investigated and points removed. • With removal of the points, the limits are then recalculated.
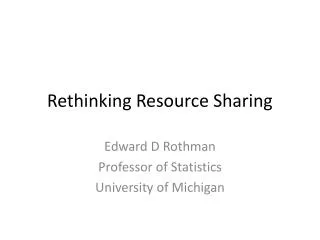
Control Charts for Fraction Nonconforming Example • A process that produces bearing housings is investigated. Ten samples of size 100 are selected. • Is this process operating in statistical control?
Control Charts for Fraction Nonconforming Example n = 100, m = 10
Control Charts for Fraction Nonconforming Example Control Limits are:
Control Charts for Fraction Nonconforming Example P C h a r t f o r C 1 0 . 1 0 3 . 0 S L = 0 . 0 9 5 3 6 n o i t r o p 0 . 0 5 o r P P = 0 . 0 3 8 0 0 0 . 0 0 - 3 . 0 S L = 0 . 0 0 0 0 1 2 3 4 5 6 7 8 9 1 0 S a m p l e N u m b e r
Control Charts for Fraction Nonconforming Interpretation of Points on the Control Chart for Fraction Nonconforming • Care must be exercised in interpreting points that plot below the lower control limit. • They often do not indicate a real improvement in process quality. • They are frequently caused by errors in the inspection process or improperly calibrated test and inspection equipment.
Variable Sample Size Variable Width Control Limits • Determine control limits for each individual sample that are based on the specific sample size. • The upper and lower control limits are
Variable Sample Size Control Limits Based on an Average Sample Size • Control charts based on the average sample size results in an approximate set of control limits. • The average sample size is given by • The upper and lower control limits are
Choice Between Attributes and Variables Control Charts • Each has its own advantages and disadvantages • Attributes data is easy to collect and several characteristics may be collected per unit. • Variables data can be more informative since specific information about the process mean and variance is obtained directly. • Variables control charts provide an indication of impending trouble (corrective action may be taken before any defectives are produced). • Attributes control charts will not react unless the process has already changed (more nonconforming items may be produced.
Guidelines for Implementing Control Charts • Determine which process characteristics to control. • Determine where the charts should be implemented in the process. • Choose the proper type of control chart. • Take action to improve processes as the result of SPC/control chart analysis. • Select data-collection systems and computer software.