Download
1 / 1
10 likes | 116 Vues
INTRODUCTION Mid-Infrared optical devices are currently being developed in the fabrication facilities at Texas A&M University. As the fabrication of these devices nears completion, it is necessary to develop the ability to accurately measure their performance.

E N D
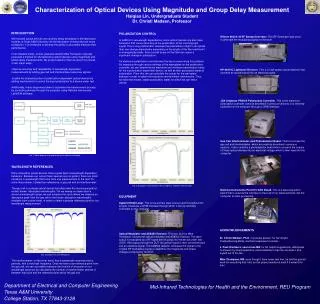
INTRODUCTION Mid-Infrared optical devices are currently being developed in the fabrication facilities at Texas A&M University. As the fabrication of these devices nears completion, it is necessary to develop the ability to accurately measure their performance. In his masters thesis, former graduate student Mike Thompson originally proposed a method for characterizing optical devices using magnitude and phase delay measurements. My project seeks to improve upon his process in two major ways: -Improve accuracy and repeatability of wavelength-dependent measurements by adding gas cell and interferometer reference signals. -Enable the characterization of polarization-dependent optical devices by adding mechanisms to control the input polarization to a device under test. Additionally, many steps were taken to automate the measurement process by controlling devices through the computer using National Instruments LabVIEW software. Fig. 1 Block diagram of group delay measurement technique POLARIZATION CONTROL In addition to wavelength dependence, some optical devices are also have behaviour that varies according to the polarization of the incoming light signal. This is very problematic, because the polarization of light in an optical fiber can change dramatically depending on the length of the fiber and how it is arranged physically. Even a small bump on the fiber can cause a significant change in polarization. An electronic polarization controller was the key to overcoming this problem. By sweeping through various settings of the waveplates on the polarization controller, we can determine the maximum and minimum transmission ratios for the a polarization-dependent device, as well as their associated states of polarization. From this, we can calculate the values for the waveplate settings in order to obtain the maximum and minimum transmission. Thus, we have two known, stable polarization states for which we can test a device. Fig. 3 Example of Calculated vs Measured Max and Min Transmissions Wiltron 6637A-40 RF Sweep Generator. This RF Generator was used to generate the modulating signal for the laser. Characterization of Optical Devices Using Magnitude and Group Delay MeasurementHaiqiao Lin, Undergraduate StudentDr. Christi Madsen, Professor HP 83410C Lightwave Reciever. This is a high-speed optical detector that converts an optical signal into an electrical signal. JDS Uniphase PR2000 Polarization Controller. This is the electronic polarization controller used as described in previous sections. It is remotely controlled on the computer through a GPIB interface. Gas Cell, Interferometer, and Photodetector Board. This box houses the gas cell and interferometer, which are used as described in previous sections. It also contains a photodetector board which converts the outputs of these optical devices into an electrical voltage which is then read into the computer. Department of Electrical and Computer Engineering Texas A&M University College Station, TX 77843-3128 WAVELENGTH REFERENCES Many interesting optical devices have a great deal of wavelength-dependent behaviour. Because our current laser sources are not perfect, there are small variations in wavelength that occur from one measurement to the next. To solve this problem, I added two references: a gas cell and an interferometer. The gas cell is a simple optical device that attenuates the incoming signal at certain known “absorption wavelengths.” As we sweep our laser source across a wavelength range, we can compare the spots where we observe an absorption peak from the gas cell to the known absorption wavelengths available from a data sheet, in order to obtain a precise reference point for our wavelength measurement. Fig. 2 Sample Gas Cell Response The interferometer, on the other hand, has a wavelength response that is periodic, with a very high frequency. Once we have a set reference point from the gas cell, we can accurately measure the location of any point on our wavelength spectrum by calculating the number of interferometer periods in between that point and the reference point set by the gas cell. National Instruments PCI-6110 DAQ Board. This is a data acquisition board that is used as the interface to input all of our measurements into the computer for post-processing. EQUIPMENT Agilent 8164A Laser. This is the primary laser source used throughout this project. It features a GPIB interface through which it can be remotely controlled on the computer. ACKNOWLEDGEMENTS Dr. Christi Madsen, Ph.D, my faculty advisor: for her insight, troubleshooting ability, and fast responses to emails… J. Paul Chambers, soon-to-be MS: for his helpful suggestions, willingness to answer my stupid questions, and availability to bail me out when I lock myself out of the lab… Mike Thompson, MS: even though I have never met him, he laid the ground work for everything that I did, so this project would not exist if it weren’t for him! Optical Modulator and AD8302 Detector. This box, built by Mike Thompson, houses the optical modulator and AD8302 Detector. The laser output is modulated by a RF signal before going into the device under test (DUT). After going through the DUT, the optical signal is then converted back into an electrical signal. The AD8302 detector compares this signal to the original RF modulating signal to determine the magnitude and phase changes produced by the DUT. Mid-Infrared Technologies for Health and the Environment, REU Program