Chapter 9: Phase Diagrams
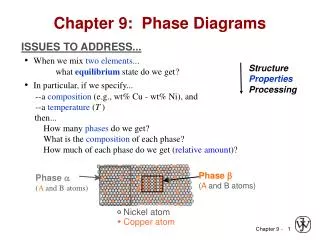
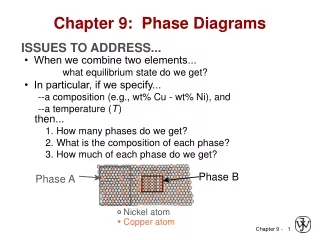
Chapter 9: Phase Diagrams. ISSUES TO ADDRESS. • When we combine two elements... what is the resulting equilibrium state?. • In particular, if we specify... -- the composition (e.g., wt% Cu - wt% Ni), and -- the temperature ( T ). then.. .

Chapter 9: Phase Diagrams
E N D
Presentation Transcript
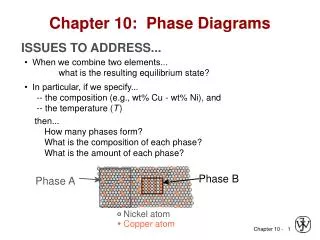
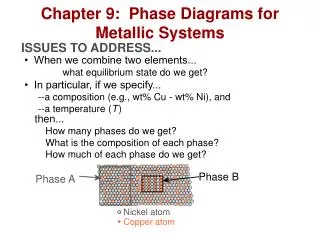
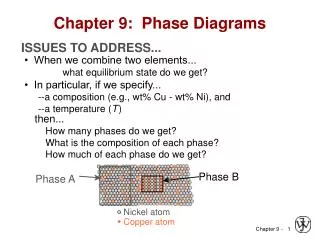
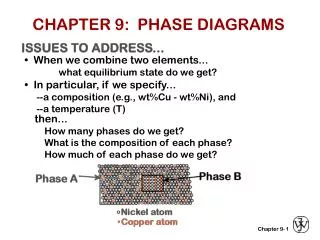
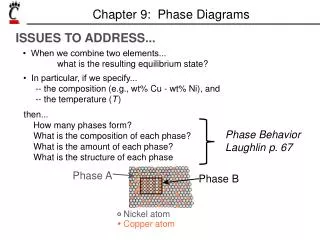
Chapter 9: Phase Diagrams ISSUES TO ADDRESS... • When we combine two elements... what is the resulting equilibrium state? • In particular, if we specify... -- the composition (e.g., wt% Cu - wt% Ni), and -- the temperature (T) then... How many phases form? What is the composition of each phase? What is the amount of each phase? What is the structure of each phase Phase Behavior Laughlin p. 67 Phase A Phase B Nickel atom Copper atom
Components and Phases • Components: The elements or compounds which are present in the alloy (e.g., Al and Cu) • Phases: The physically and chemically distinct material regions that form (e.g.,αand β). Optical Mettalography α (lighter phase) β (darker 1µm phase) Aluminum-CopperAlloy
Sugar/Water Phase Diagram 10 0 Solubility L Limit 8 0 (liquid) 6 0 + L Temperature (ºC) S 4 0 (syrup) (solid 20 sugar) 0 20 40 60 80 100 Composition (wt% sugar) Solubility Limit • Solution – solid, liquid, or gas solutions, single phase • Mixture – more than one phase • Solubility Limit: Maximum concentration for which only a single phase solution exists. Question: What is the solubility limit for sugar in water at 20ºC? 65 Problem 9.2: At 170°C, what is the maximum solubility (a) of Pb in Sn? (b) of Sn in Pb? The lead-tin phase diagram is shown in theAnimated Figure 9.8.
Isomorphous Binary Phase Diagram Cu-Ni phase diagram 1600 • System is: 1500 L (liquid) -- binary 2 components: Cu and Ni. 1400 α liquidus T(ºC) + 1300 -- isomorphous i.e., completesolubility of one component inanother L solidus α 1200 1100 solid solution 1000 0 20 40 60 80 100 wt% Ni
Criteria for Solid Solubility: Hume–Rothery rules • Same crystal structure • Similar electronegativities • Similar atomic radii • Ni and Cu are totally soluble in one another for all proportions.
Structure BCC FCC
1 phase: α B (1250ºC, 35 wt% Ni): (1250ºC,35) 2 phases: L +α B A(1100ºC,60) Determination of phases present • If we know T and Co, then we know which phases are present. Cu-Ni phase diagram 1600 1500 L • Examples: 1400 A(1100ºC, 60 wt% Ni): α T(ºC) + 1300 L α 1200 1100 1000 0 20 40 60 80 100 wt% Ni
T(ºC) tie line L 1300 α + Mα ML L B T B α 1200 R S S R 20 3 0 4 0 5 0 C0 CL Cα wt% Ni Determination of phase compositions: Lever Rule Tie line –– also sometimes called an isotherm • What fraction of each phase? Think of the tie line as a lever • (teeter-totter)
Slow Cooling of a Cu-Ni Alloy L: 35 wt% Ni α: 46 wt% Ni 35 46 32 43 L: 32 wt% Ni 24 36 a: 43 wt% Ni L: 24 wt% Ni a: 36 wt% Ni C0= 35 wt% Ni alloy T(ºC) L: 35wt%Ni L 130 0 120 0 α 110 0 35 20 3 0 4 0 5 0 wt% Ni C0
Cored vs Equilibrium Structures 35 46 32 43 24 36 Last a to solidify: < 35 wt% Ni T(ºC) L 130 0 Uniform Ca: Firstαto solidify: 35 wt% Ni 46 wt% Ni 120 0 α 110 0 35 20 3 0 4 0 5 0 wt% Ni C0
60 %EL for pure Cu 400 %EL for 50 pure Ni TS for Elongation (%EL) 40 pure Ni Tensile Strength (MPa) 300 30 TS for pure Cu 200 20 0 20 40 60 80 100 0 20 40 60 80 100 Cu Ni Cu Ni Composition, wt% Ni Composition, wt% Ni Mechanical Properties:Cu-Ni System • Effect of solid solution strengthening on: -- Tensile strength (TS) -- Ductility (%EL)
Binary-Eutectic Systems cooling heating =low melting 2 components Cu-Ag system Ex.: Cu-Ag system 1200 L (liquid) • 3 single phase regions 1000 (L,α, β) α L + α β L + 779ºC β 800 TE 8.0 91.2 71.9 600 α + β 400 200 80 100 0 20 40 60 CE wt% Ag Eutectic Phase Reaction:
MicrostructuralDevelopment in Eutectic Systems I Pb-Sn T(ºC) L: C0wt% Sn 400 L α L 300 L α + α 200 α: C0wt% Sn TE 100 β + α 0 10 20 30 wt% Sn C0 2 (room T solubility limit) • For alloys for which C0 < 2 wt% Sn • Result: at room temperature -- polycrystalline with grains of a phase having composition C0
MicrostructuralDevelopment in Eutectic Systems II L: C0 wt% Sn T(ºC) 400 L L 300 α L + α a: C0wt% Sn α 200 TE α β 100 β + α 0 10 20 30 C , wt% Sn C0 2 (sol. limit at T ) 18.3 room (sol. limit at TE) • For alloys for which 2 wt% Sn < C0 < 18.3 wt% Sn • Result: at temperatures inα+βrange -- polycrystalline with agrains and smallβ-phase particles
MicrostructuralDevelopment in Eutectic Systems III T(ºC) Micrograph of Pb-Sn eutectic microstructure L: C0 wt% Sn 300 L α L + α β 200 183ºC TE 100 160μm β: 97.8 wt% Sn α: 18.3 wt%Sn 0 20 40 60 80 100 97.8 18.3 CE wt% Sn 61.9 • For alloy of composition C0 = CE • Result: Eutectic microstructure (lamellar structure) -- alternating layers (lamellae) ofαandβphases.
MicrostructuralDevelopment in Eutectic Systems IV • Just above TE : T(ºC) L: C0 wt% Sn Cα = 18.3 wt% Sn L α CL = 61.9 wt% Sn 300 L S Wα α L + = 0.50 = R + S α WL = (1- W ) = 0.50 α R S 200 TE S R • Just below TE : C = 18.3 wt% Sn α 100 α primary C = 97.8 wt% Sn β α eutectic S β eutectic W α = 0.73 = R + S 0 20 40 60 80 100 W = 0.27 β 18.3 61.9 97.8 wt% Sn • For alloys for which 18.3 wt% Sn < C0 < 61.9 wt% Sn • Result:αphase particles and a eutectic microconstituent
Hypoeutectic & Hypereutectic hypoeutectic: C0 = 50 wt% Sn hypereutectic: (illustration only) α β α β α α β β α β α β 175 mm 300 L T(ºC) α L + α β β L + 200 TE System) α + β 100 C, wt% Sn 0 20 40 60 80 100 eutectic 61.9 eutectic: C0=61.9wt% Sn 160 mm eutectic micro-constituent
Intermetallic Compounds Mg2Pb Note: intermetallic compound exists as a line - not an area – becausestoichiometry(i.e. composition of a compound) is fixed.
Eutectic - liquid transforms to two solid phases L S1+S3(For Pb-Sn, 183ºC, 61.9 wt% Sn) cool cool cool heat heat heat Eutectic, Eutectoid, & Peritectic • Eutectoid–all solid phases • S2S1+S3 • ϒα+ Fe3C (For Fe-C, 727ºC, 0.76 wt% C) intermetallic compound - cementite • Peritectic - liquid and one solid phase transform to a second solid phase • S1 + LS2 • δ+ Lϒ(For Fe-C, 1493ºC, 0.16 wt% C) • Peritectoid – all solid phases • S1 + S2S3
Eutectoid transformationδγ+ε Eutectoid & Peritectic Cu-Zn Phase diagram Peritectic transformation γ+ Lδ
T(ºC) 1600 δ - Eutectic (A): L 1400 → γ + L Fe3C γ +L γ A 1200 1148ºC - Eutectoid (B): (austenite) γ → α + Fe3C γ γ 1000 γ +Fe3C γ γ α Fe3C (cementite) + 800 B γ α 727ºC = T eutectoid 600 α +Fe3C 400 0 1 2 3 4 5 6 6.7 4.30 0.76 wt% C (Fe) 120 mm Result: Pearlite = Fe3C (cementite-hard) alternating layers of α (ferrite-soft) α and Fe3C phases Iron-Carbon (Fe-C) Phase Diagram L+Fe3C
1600 T(ºC) δ L 1400 γ +L γ γ γ 1200 L+Fe3C 1148ºC γ γ (austenite) 1000 γ +Fe3C γ γ Fe3C 800 a γ 600 α +Fe3C 400 0 1 2 3 4 5 6 6.7 C, wt%C (Fe) pearlite Hypereutectoid Steel proeutectoid Fe3C 60μm pearlite C0 0.76
1600 T(ºC) δ L 1400 γ +L γ γ γ 1200 L+Fe3C 1148ºC (austenite) γ γ 1000 γ +Fe3C γ γ 800 727ºC α γ γ 600 α +Fe3C 400 0 1 2 3 4 5 6 6.7 C, wt% C (Fe) C0 0.76 Hypoeutectoid Steel 100μm pearlite proeutectoid ferrite α α pearlite For a 99.6 wt% Fe-0.40 wt% C steel at a temperature just below the eutectoid, determine the following: • The compositions of Fe3C and ferrite (α). • The amount of cementite (in grams) that forms in 100 g of steel. • The amounts of pearlite and proeutectoid ferrite (α) in the 100 g.
1600 δ L 1400 T(ºC) γ +L γ 1200 L+Fe3C 1148ºC (austenite) 1000 γ +Fe3C Fe3C (cementite) 800 727ºC Amount of Fe3C in 100 g = (100 g)WFe3C = (100 g)(0.057) = 5.7 g R S 600 α +Fe3C 400 0 1 2 3 4 5 6 6.7 C0 Cα C, wt% C CFe C 3 Solution to Example Problem • The compositions of Fe3C and ferrite (α). • RStie line just below the eutectoid Cα= 0.022 wt% CCFe3C = 6.70 wt% C pearlite • Wight Fraction of cementite
c) Using the VX tie line just above the eutectoid and realizing that 1600 δ L 1400 T(ºC) γ +L γ 1200 L+Fe3C 1148ºC (austenite) 1000 γ +Fe3C Fe3C (cementite) 800 727ºC V X Amount of pearlite in 100 g = (100 g)Wpearlite = (100 g)(0.512) = 51.2 g 600 α +Fe3C 400 C0 0 1 2 3 4 5 6 6.7 Cγ Cα C, wt% C The amounts of pearlite in the 100 g. α C0 = 0.40 wt% CCα= 0.022 wt% CCpearlite = Cγ= 0.76 wt% C pearlite
Alloying with Other Elements • Teutectoid changes: • Ceutectoid changes: (wt% C) Ti Si Mo (ºC) Ni W Cr Cr eutectoid Eutectoid Si Mn W Mn Ti Mo C T Ni wt. % of alloying elements wt. % of alloying elements
VMSE: Interactive Phase Diagrams Microstructure, phase compositions, and phase fractions respond interactively Change alloy composition
Summary • Phase diagrams are useful tools to determine: -- the number and types of phases present, -- the composition of each phase, -- and the weight fraction of each phase given the temperature and composition of the system. • The microstructure of an alloy depends on -- its composition, and -- whether or not cooling rate allows for maintenance of equilibrium. • Important phase diagram phase transformations include eutectic, eutectoid, and peritectic.
B(100ºC,C = 70) 1 phase D(100ºC,C = 90) 2 phases 100 L 80 (liquid) + 60 L S Temperature (ºC) ( liquid solution (solid 40 i.e., syrup) sugar) A(20ºC,C = 70) 2 phases 20 0 0 20 40 60 70 80 100 C = Composition (wt% sugar) Effect of Temperature & Composition path A to B. • Altering T can change # of phases: • Altering C can change # of phases: path B to D.
EX 1: Pb-Sn Eutectic System T(ºC) 300 L (liquid) α L + α β β L + 200 183ºC 18.3 61.9 97.8 Cβ- C0 150 S R S = W = α R+S Cβ- Cα 100 α + β 99 - 40 59 = = = 0.67 99 - 11 88 100 0 11 20 60 80 99 40 C0- Cα R W Cα Cβ C0 = = β wt% Sn Cβ- Cα R+S 40 - 11 29 = = 0.33 = 99 - 11 88 • For a 40 wt% Sn-60 wt% Pb alloy at 150ºC Cα= 11 wt% Sn Pb-Snsystem Cβ= 99 wt% Sn -- the relative amount of each phase
EX 2: Pb-Sn Eutectic System T(ºC) CL - C0 46 - 40 = W = a CL - Cα 46 - 17 300 L 6 α L + = = 0.21 29 220 α β β R L + S 200 183ºC 100 a + b 100 17 46 0 20 40 60 80 Cα CL C0 wt% Sn C0 - Cα 23 = WL = = 0.79 CL - Cα 29 • For a 40 wt% Sn-60 wt% Pb alloy at 220ºC Ca= 17 wt% Sn CL = 46 wt% Sn the relative amount of each phase