Download
1 / 40
400 likes | 585 Vues
INFORMAÇÕES RECENTES PARA OTIMIZAÇÃO DA PRODUÇÃO AGRÍCOLA Piracicaba-SP, Brazil 15-16 March 2007. Integrated Plant Nutrition for Better Soybean Quality. Tom Bruulsema Director, Northeast Region, North American Program. IPNI Mission.

E N D
INFORMAÇÕES RECENTES PARA OTIMIZAÇÃO DA PRODUÇÃO AGRÍCOLA Piracicaba-SP, Brazil 15-16 March 2007 Integrated Plant Nutrition for Better Soybean Quality Tom Bruulsema Director, Northeast Region, North American Program
IPNI Mission • “to develop and promote scientific information about the responsible management of plant nutrients for the benefit of the human family.”
Outline – Optimal Soybean Nutrition • Ontario soybean yield and K • Functional Food Components • Nutraceuticals • Isoflavones and K • Protein and Oil • Plant Health
Fertilizing Soybeans • N – legume • P & K – often sufficient following corn • Responses infrequent, compared to corn • Removal rates: • N: 4.0 lb/bu • P2O5: 0.8 lb/bu • K2O: 1.4 lb/bu • S: 0.34 lb/bu
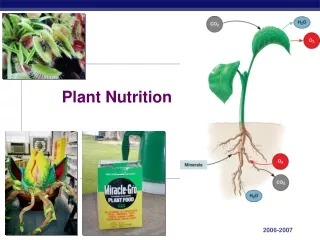
N P2O5 K2O Aerial accumulation of N, P, and K by soybeans (80 bu/A)
Critical Level for Maximum Yield Example from Ontario: Leaf K in Soybean Yin and Vyn, 2004
Zhang et al., 2003. Better Crops Vol. 87 No. 4 Soybean yield response to K was economic only in 1 of 4 years. Mean of 5 cultivars, Harrow, Ontario, Canada.
Zhang et al., 2003. Better Crops Vol. 87 No. 4 Cultivar S20-20 responded differently to sulfate of potash magnesia than the other four cultivars. Mean of 4 years, 1999-2002.
Zhang et al., 2003. Better Crops Vol. 87 No. 4 Soybean cultivars showed slight differences in preference for Cl or sulfate sources. Mean of 4 years, 1999-2002.
Functional Foods: lead the list of consumer trends - market opportunities for crop producers (Successful Farming; @g Online; Better Homes & Gardens)
Phytochemical Examples Science 285:377, 1999
FDA & the Soy Health Claim • 20 Oct 1999: foods containing soy protein • Reduced risk for heart disease • Isoflavones - genistein, daidzein • CVD, cancer, antioxidant, phytoestrogen • Isoflavone market year ending March 2001 was worth $118 million – Cargill & ADM • Possible role in animal feeds: increased muscle % in swine (Iowa State University, 1998)
Factors Influencing Isoflavones in Soybean • Temperature • Variety • Maturity Group • Irrigation • Yield Walt Fehr, Iowa State University, 2001 Tsukamoto et al., 1995 Dayde & Lacombe, 2000 (France)
Isoflavone levels in relation to soybean seed K content Ontario, Canada.
Isoflavone levels in soybean seeds in relation to yield. Ontario, 1998-1999
Concentration of isoflavones in soybean seeds in response to applied K fertilizer(two sites, three years, 1998-2000). Vyn et al., 2002. Journal of Agricultural and Food Chemistry, 50: 3501-3506.
Impact of stratification of soil test K on critical values of leaf K for maximum levels of yield, seed K, oil and isoflavones in soybeans (adapted from Yin and Vyn, 2004). KSC = soil test K stratification coefficient (0-5 cm depth divided by 10-20 cm depth).
Two Responsive Sites No-till soybeans, 3-year average, 1998-2000 Lambton: High soil test K, clay loam soil Paris: Low soil test K, sandy loam soil T.J. Vyn & Xinhua Yin
Residual K effect No-till soybeans, 2-year average, 1998-1999 Paris: Low soil test K, sandy loam soil T.J. Vyn & Xinhua Yin
Harrow, Ontario, 2000 Perth clay loam Zhang, T-Q., Rajcan, I, & Jackson, C-J. K2SO4 2MgSO4 No K KCl K2SO4
Soybeans: Lambton 1999 Soil test K – high to very high No-till soybeans T.J. Vyn & Xinhua Yin
K Effect on Protein and Oil T.J. Vyn, Paris, 1998-1999
P&K Effects on Soybean 2-year average, Virginia
Potassium Effect on Protein, Oil and Sugar(Harrow, Ontario) Potassium slightly increased oil and sugar but decreased protein. Mean of five cultivars over four years, 1999-2002 (Zhang et al., 2003).
Potash Increases Yield and Seed Quality Soybean cv. Ogden, North Carolina
Fertilizer Increases Yield and Quality Indiana soybeans
Nutrients Impact Diseases • Sudden death syndrome • Reduced 36% by chloride; increased by sulfate or nitrate (Sanogo and Yang, 2001) • Reduced by chloride (Howard et al., 1999) • Phytophthora root rot, mosaic virus • Reduced by NPK together, not alone (Pacumbaba, 1997) • Stem canker • Reduced incidence with N, P, or K, in Alabama and Mississippi (Rhoton, 1989) • Anthracnose and Phomopsis • K suppressed both; P slightly increased Phomopsis (Sij et al., 1985)
Nutrients Impact Diseases (2) • Phytophthora stem rot: • Zoospore release inhibited by application of a solution of 2.5 mM K and 5.1 mM Ca (Sugimoto et al., 2007) • Frog’s Eyespot and Downey mildew • Cercospora sojina, Peronospora manshuria in Minas Gerais (Nolla et al., 2006) • Reduced by application of 1.5 to 12 t ha-1 of calcium silicate • No effect on Asian rust (Phakopsora pachyrhizi )
Potassium Fertilizer Reduces Disease • Virginia soybeans • soil low in K and very high in P • two-year averages; 1971 and 1972 • all fertilizer applied in 1969
Soybean Stem Canker Influence of soil fertility on soybean leaf tissue P and K and stem canker infection (Rhoton, 1989).
Stress Tolerance Effect of K in nutrient solution on leaf K and water stress effect on whole leaf CO2 uptake of wheat (adapted from Pier and Berkowitz, 1987).
Woodstock, Ontario 12 September 2000 OSCIA plot Leaf K August 2000 1.40% Leaf K August 2000 0.96% Soil Test K = 50-55 ppm; pH = 7.2
Woodstock, Ontario 12 September 2000 OSCIA plot K deficiency symptoms Near top of plant Low temp or frost injury?
Summary • While soybeans often produce high yield and quality with residual nutrition following corn, optimum nutrition cannot be taken for granted • Managing nutrients to optimum levels improves isoflavones, protein, oil, and plant health • Soil testing, plant analysis, and matching nutrient applications to removals are important aspects of optimal nutrient management
www.ipni.net Thank You!