Download
1 / 19
190 likes | 341 Vues
ENGR 224/STAT 224 Probability and Statistics Lecture 7. Example: Casinos.

E N D
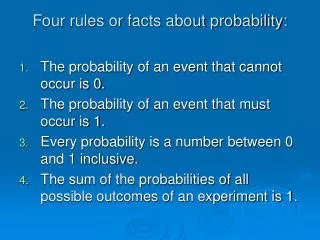
Example: Casinos • In casinos when the manager suspects cheating at a dice table, the manager will compare the frequency distribution of the actual sample outcomes to a theoretical model that describes the frequency distribution likely to occur with fair dice. • The above is an example of inferential statistics. • However, before we begin making inferences we must have an understanding of the theoretical models used.
Definition: Random Variable • A random variable assigns a numerical value to each outcome of an experiment. • Notation: A random variable X (upper case) takes on values x(lower case). • Example: Consider a test with 4 true/false questions on it. Let the random variable X be the number of correct responses, then x can take on values of 0, 1, 2, 3, 4
Definitions: Discrete and Continuous Random Variables • A discrete random variable has either a finite number of values or a countably infinite set of values. • A Bernoulli random variable is any discrete random variable with only two values. • A continuous random variable has infinitely many values, usually over intervals.
Definition: Probability Distribution • A probability distribution or probability mass function (pmf) , p(x), gives the probability for each value of the random variable x;
Example: Satellites in orbit Suppose 3 satellites are launched into space. Let X denote the number of satellites that go into orbit. Describe the random variable X, and calculate its probability distribution. The likelihood of each outcome is equal. Sample Space ooo oom omo moo omm mom mmo mmm Assign X 3 2 2 2 1 1 1 0 Probability Distribution: x P(X = x) 0 1/8 1 3/8 2 3/8 3 1/8
Example: IBM Computer Sales The IBM computer company finds that the probabilities of selling 0, 1, 2, 3, and 4 computers in one day are .245, .370, .210, .095, .080 respectively. A) Is this a probability distribution? B) Calculate the probability of selling 2 or 3 computers in a day. C) Calculate the probability of at least 4 computers being sold.
Example: IBM Computer Sales Solutions: • A) Each probability is positive and less than 1 so property (1) of probability distributions is true. The sum of the probabilities equals 1 so property (2) is also satisfied. • B) 210 + .095 = .305 • C) .080
Definition: Cumulative Distribution Function • A cumulative distributionfunction (cdf), F(x) of a probability mass function p(x), gives the probability that the value of the random variable is at most x;
Example: IBM Computer Sales The IBM computer company finds that the probabilities of selling 0, 1, 2, 3, and 4 computers in one day are .245, .370, .210, .095, .080 respectively. What is the cdf?
Definition: Probability using cdf • The probability that a random variable X is greater than or equal to a and less than or equal to b is
Definition: Expected Value or Mean • The mean of a discrete random variable X is • N.B. • The p(xi) are the probabilities of X = xi , or p(xi) = P(X= xi) • Mean is also called the Expected Value, denoted as E(X) • If the random variable represents a theoretical model then m = the population mean
Example: IBM Computer Sales The IBM computer company finds that the probabilities of selling 0, 1, 2, 3, and 4 computers in one day are .245, .370, .210, .095, .080 respectively. What is the mean number of computers being sold? Solution: m = 0(.245)+1(.370)+2(.210)+3(.095)+4(.080) = 1.395
Example: Expected Value Consider playing the following dice game. To play one must pay 1 dollar to roll the die. If you roll a six you receive 5 dollars. Anything else you loose. Calculate the expected value of the net winnings. Solution: Let X = net winnings = WIN - LOSS X P(X = xi) -1 5/6 4 1/6 Therefore the expected net winnings is E(X) = -1(5/6)+4*(1/6) = -1/6 dollars about 17 cents loss
In planning a huge outdoor concert for June 16, the producer estimates the attendance will depend on the weather according to the following table. She also finds out from the local weather office what the weather has been like, for June days in the past 10 years. Weather Attendance Relative Frequency wet, cold 5,000 .20 wet, warm 20,000 .20 dry, cold 30,000 .10 dry, warm 50,000 .50 What is the expected (mean) attendance? The tickets will sell for $9 each. The costs will be $2 per person for the cleaning and crowd-control, plus $150,000 for the band, plus $60,000 for administration (including the facilities). Would you advise the producer to go ahead with the concert, or not? Why? Example: Concert Planning
Problem 11 Problem 15 Problem 23 Practice Problems
Overview • Definitions: Random Variables, Probability Distribution, Probability Mass Function, Cumulative Mass Function • Discrete Probability Distributions • Mean or Expected Value,
Homework • For next class do problem set • Reread sections 3.1, 3.2, • Read sections 3.3, 3.4.