Measurement System Analysis
Process Analysis and Documentation. Probability and Statistics. Collecting and summarising data. Measurement System Analysis. Six Sigma and the organisation. Six Sigma - Define. Six Sigma - Measure. Probability distributions. Process Capability and Performance. Six Sigma - Analyse.


Measurement System Analysis
E N D
Presentation Transcript
Process Analysis and Documentation Probability and Statistics Collecting and summarising data Measurement System Analysis Six Sigma and the organisation Six Sigma - Define Six Sigma - Measure Probability distributions Process Capability and Performance Six Sigma - Analyse Six Sigma – improve & Control
Six Sigma - Measure PROCESS ANALYSIS AND DOCUMENTATION • Process Modeling • Process Inputs and Outputs
Why have a process focus? • So we can understand how and why work gets done • To characterize customer & supplier relationships • To manage for maximum customer satisfaction while utilizing minimum resources • To see the process from start to finish as it is currently being performed • Blame the process, not the people proc•ess (pros′es) n. – A repetitive and systematicseries of steps or activitieswhere inputs are modified to achieve a value-added output What is a Process?
Examples of Processes We go through processes everyday. Below are some examples of those processes. Can you think of other processes within your daily environment? • Injection molding • Decanting solutions • Filling vial/bottles • Crushing ore • Refining oil • Turning screws • Building custom homes • Paving roads • Changing a tire • Recruiting staff • Processing invoices • Conducting research • Opening accounts • Reconciling accounts • Filling out a timesheet • Distributing mail • Backing up files • Issuing purchase orders
The purpose of Process Maps is to: • Identify the complexity of the process • Communicate the focus of problem solving • Process Maps are living documents and must be changed as the process is changed • They represent what is currently happening, not what you think is happening. • They should be created by the people who are closest to the process Process Map Inspect Start Step A Step B Step C Step D Finish Process Maps
Standard symbols for Process Mapping (available in Microsoft Office™, Visio™, iGrafx™ , SigmaFlow™ and other products): A RECTANGLEindicates an activity. Statements within the rectangle should begin with a verb A PARALLELAGRAMshows that there are data ADIAMONDsignifies a decision point. Only two paths emerge from a decision point: No and Yes An ELLIPSEshows the start and end of the process ACIRCLE WITH A LETTER OR NUMBER INSIDEsymbolizes the continuation of a flowchart to another page An ARROWshows the connection and direction of flow 1 Process Map Symbols
High Level Process Map One of the deliverables from the Define Phase is a high level Process Map, which at a minimum must include: • Start and stop points • All process steps • All decision points • Directional flow • Value categories as defined below • Value Added: • Physically transforms the “thing” going through the process • Must be done right the first time • Meaningful from the customer’s perspective (is the customer willing to pay for it?) • Value Enabling: • Satisfies requirements of non-paying external stakeholders (government regulations) • Non-Value Added • Everything else
B Z START REVIEW CASE LOGOFF PHONE, CHECK LOGON TO PC & TOOL HISTORY & MAIL,E-MAIL,VOICE MAIL APPLICATIONS TAKE NOTES E Y C SCHEDULED A N PHONE TIME? SCHEDULED Z Y TRANSFER PHONE TIME? TRANSFER D APPROPRIATE? N CALL Y A EXAMINE NEXT NOTE N OR RESEARCH ITEM LOGON TO PHONE IMMEDIATE PROVIDE Y F ACCESS CASE TOOL Y RESPONSE RESPONSE PHONE D AVAILABLE? PHONE& TIME WALK-IN NOTE N CALL or ENTER APPROPRIATE DATA ENDS N WALK-IN? SSAN (#,9s,0s) Z CALL PUT ON HOLD, REFER TO IF EMP DATA NOT PHONE DATA REFERENCES POPULATED, ENTER CAPTURE BEGINS CREATE A CASE Y INCL CASE TYPE N ANSWER? OLD DETERMINE WHO DATE/TIME, & CASE IS INQUIRING N NEEDED BY Y QUERY INTERNAL UPDATE ENTRIES ACCESS CASE TOOL HRSC SME(S) INCL OPEN DATE/TIME Y AUTO ROUTE ROUTE N DETERMINE NATURE Y OF CALL & CONFIRM ANSWER? UNDERSTANDING Y CLOSE CASE CASE N W/ E CLOSED DATE/TIME N N CASE TOOL OFF HOLD AND ADD TO C RECORD? ARRANGE CALL RESEARCH E GO TO BACK PHONE DATA LIST TAKE ACTION F or E Y ENDS NEXT or DEPENDING ON F DO RESEARCH B CASE Process Map – Call Centre
Sending Fund Transfers Attach ACH form to Invoice ACH – Automated Clearing House. Request transfer Start Department Fill out ACH enrollment form Receive payment Produce an Invoice No End Vendor Match against bank batch and daily cash batch Maintain database to balance ACH transfers Vendor info in FRS? Financial Accounting Input info into web interface Yes Accepts transactions, transfer money and provide batch total Bank Review and Process transfer in FRS 21.0 Bank Reconciliation General Accounting 3.0 Journey Entry Cross Functional Process Map When multiple departments or functional groups are involved in a complex process it is often useful to use cross functional Process Maps. • Draw in either vertical or horizontal Swim Lanes and label the functional groups and draw the Process Map
Process Map Exercise • Exercise objective: Using your favorite Process Mapping tool create a Process Map of your project or functional area. • Create a high level Process Map, use enough detail to make it useful. • It is helpful to use rectangular post-it’s for process steps and square ones turned to a diamond for decision points. • Color code the value added (green) and non-value added (red) steps. • Be prepared to discuss the result
Mapping: Inventory and Distance • Starts with a layout drawing • Walk the process, observe & record data (inventory and distance) • Repeat on different days if necessary • Complete maps to show inventory location and distance traveled • Inventory Map: shows locations of WIP buildup • Spaghetti Diagram: shows ‘flow’ of product (distance traveled)
Spaghetti Diagram PROCESS FLOW – SPAGHETTI DIAGRAM
Example: Process Flow Analysis • Date: March 13th, 2006 • WIP = 549 orders • Estimated distance transport for each order: 105 metres • Total Process Time: 158 min (from standards) • 2.64 hours • 0.4 days • 6% of total time in process • Total non-value added time in process: 2651 min • 44.2 hrs • 6.63 days • 94% of total time • Estimated order time in process: 7.02 days
Inventory Map: Physical WIP Count 9 23 15 22 502 20 18 120 8 7 13 33 24 15 3 60 11 14 30 15 25 5 15 total 1007
Proposal 20 50 Mail Store 5 5 5 5 5 20 5 5 5 5 5 5 5 5 5 5 5 5 total 175 + store
SIPOC: A high level view of a process Requirements Requirements Input Boundary Output Boundary Customers Process Outputs Suppliers Inputs Measures Measures Measures
Basis of SIPOC Supplier Input Process Output Customer • Identify and balance competing customer requirements. • Identify gaps in requirements and the process outputs or inputs responsible. • Aid in identification of data collection needs. • Identify the suppliers, process owners and other stakeholders • Validate goal alignment and metric alignment from customer to supplier • Verify team and information resource requirements.
SIPOC Validation With your SIPOC complete, you can now use it to: • Verify the link between the “outputs” and customer requirements so you can measure how well the process is meeting customer requirements. • Ensure that the team problem statement matches at least one of the customer requirements and you have identified secondary requirements that might be effected by the project. • Identify gaps between input requirements and the customer requirements. Prioritise competing customer requirements. • Ensure your team has access to suppliers, process experts and customers necessary to close any identified gaps.
Key Stakeholdeers We need to identify all the Key Stakeholders early on so that we can plan how to engage them • Approvers: Sponsor, Business Owner, Budget Holder • Blockers: Other Functions who control aspects of the process, legal, regulatory • Influencers: Key individuals who will be listened to by the Approvers and Blockers
Based on an analysis of stakeholders, you can develop a communications plan for the project to meet stakeholder needs. Communication Plan Audience Names Messages Media Vehicle Frequency Timing Responsibility Operations MC Project Status Tollgate Reviews 1x/phase End of phase Lorna 1x/phase End of phase Lorna Tollgate Reviews Business Champion Project Status PK emails bi-weekly Ongoing Siobhan Project Status LSS Champion AOB weekly Lorna Ops Excellence Team Meeting Ongoing E-Mails As needed Ongoing Siobhan Internal Communication AR PS FK MS SS IT Team Weekly Face to Face meeting Ongoing 1x/phase Siobhan
Cause & Effect: The Process equation All Products and Services are delivered through processes. Processes should be managed by their inputs not their outputs. The Age Old Question – What Makes a Good Pint ? • Y = A Good Pint • X1 . . . XN • Clean Pipes • Correct Gas settings • Bar Tender Experience • Correct Glass • Age of Keg • Etc. A good publican doesn’t manage this process by tasting all pints or by waiting for customers to complain or, worse still, leave.
Cause & Effect Diagram Method Machine Man Effect Material Mother Nature Measurement Starts with a question … What could cause … ?
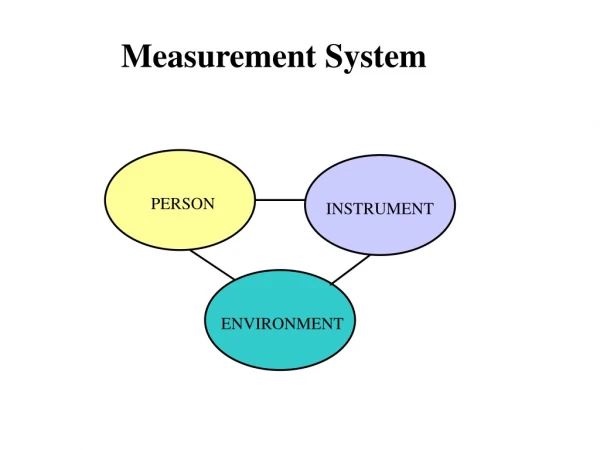
Transactional / service Sources of variation People Procedures Policies Five Key Sources of Variation Environment + Measurement Place Use cause and effect diagram to single out variation sources within the “4P’s + M&E”
Process Analysis and Documentation Probability and Statistics Collecting and summarising data Measurement System Analysis Six Sigma and the organisation Six Sigma - Define Six Sigma - Measure Probability distributions Process Capability and Performance Six Sigma - Analyse Six Sigma – improve & Control
Probability and statistics Statistics are used to draw valid conclusions from a situation. • Population = the collection of ALL items or data under consideration • Descriptive Study – uses all data from a population • A sample is a subset of the population. • Samples are selected randomly in order to be representative. • It is tradition to denote sample statistics using Latin letters and population parameters using Greek letters Notation:
Central Limit Theorem The CLT states that • Population = the collection of ALL items or data under consideration • Descriptive Study – uses all data from a population • A sample is a subset of the population. • Samples are selected randomly in order to be representative. • It is tradition to denote sample statistics using Latin letters and population parameters using Greek letters Notation:
Central Limit Theorem Given: 1. The random variable x has a distribution (which may or may not be normal) with mean µ and standard deviation . 2. Samples all of the same size n are randomly selected from the population of x values. 1. The distribution of sample x will, as the sample size increases, approach a normal distribution. 2. The mean of the sample means will be the population mean µ. 3. The standard deviation of the sample means will approach σ √ n
Practical rules • For samples of size n larger than 30, the distribution of the sample means can be approximated reasonably well by a normal distribution. The approximation gets better as the sample size n becomes larger. 2. If the original population is itself normally distributed, then the sample means will be normally distributed for any sample sizen (not just the values of n larger than 30).
Notation the mean of the sample means the standard deviation of sample mean (often called standard error of the mean) µx=µ x= n
Example Distribution of 200 digits from Social Security Numbers (Last 4 digits from 50 students)
Distribution of sample means Distribution of 50 Sample Means for 50 Students As the sample size increases, the sampling distribution of sample means approaches a normal distribution.
Central Limit Theorem For any population distribution, the distribution of sample means approaches a normal distribution as the sample size increases.
Basic Probability Concepts The probability that a particular event will occur is a number between 0 and 1 inclusive. If a jar containing 100 marbles has 5 red marbles, the probability of randomly selecting a red marble is .05 or 5%. This is written as P (Red) = .05 Random implies that each marble has an equal chance of being selected. If the jar had no red marbles, the probability would be 0. If the jar had all red marbles, the probability would be 1.
Basic Probability Concepts Complementation Rule: The probability that event A will not occur is 1 – (the probability that A does occur) Or P(not A) = 1 – P(A) If the probability of selecting a red marble was 0.4, the complement of not selecting a red marble would be 0.6. P (Red) = 0.4 P (not Red) = 1 – 0.4 = 0.6
Basic Probability Concepts Conditional Probability: Suppose the jar contains only 5 marbles, 3 white and 2 black. The probability that the first marble selected is black is 2 / (2+3) = 2 / 5 The probability that the second marble selected is black (given that first was black) is 1 / (1+3) = 1 / 4 The probability that both marbles selected are black is 2 / 5 x 1 / 4 = 2 / 20 = 1 / 10
Basic Probability Concepts Mutually Exclusive Events: If two events are mutually exclusive, then P (A ∪ B) = P (A) + P (B) If two events are not mutually exclusive, then P (A ∪ B) = P (A) + P (B) - P (A ∩ B)
Multiplicative Law Dependent Events: If two events are mutually exclusive, then P (A ∩ B) = P (A) + P (B) Example: A production lot of 50 units has 10 defective units. 3 units were sampled at random from the production lot. What is the probability that all 3 are defective? P (A ∩ B) = 10/50 x 9/49 x 8/48 = 720/117,600 = 0.0061 Or 0.6% If events are independent An electronic board has 2 major components. Probability of component A working is 0.7 Component B is 0.8 What is the probability that the assembly will work? P (A ∩ B) = 0.7 x 0.8 = 0.56
Process Analysis and Documentation Probability and Statistics Collecting and summarising data Measurement System Analysis Six Sigma and the organisation Six Sigma - Define Six Sigma - Measure Probability distributions Process Capability and Performance Six Sigma - Analyse Six Sigma – improve & Control
Time Definition of Data Types Attribute (Discrete) Variable (Continuous) Caliper NO-GO GO SHIPPING ORDER QTY UNIT DESCRIPTION TOTAL 1 $10.00 $10.00 3 $1.50 $4.50 10 $10.00 $10.00 2 $5.00 $10.00 Error FAIL PASS TEMPERATURE Thermometer Electrical Circuit
Attribute vs Variable Data Which type of data ? Variable Attribute ü Length in millimeters SMC (standard manufacturing cost) Number of breakdowns per day Average daily temperature Proportion of defective items Number of spars with concession Lead time (days) Mean time between failure ü ü ü ü ü ü ü
The Advantages of Variable Data Variable Attribute
Data Collection Planning Steps to Plan Data Collection: • Define the question the team would like answered. • Create an operational definition of the measurement. • Decide how the data should be analysed and displayed • Determine the following: • Who will collect the data • How will the data be collected and recorded • How much data will be collected • Over what time period will the data be collection • Who needs to be informed of the data collection activity • How will the data collection plan be validated • What decision will the data help the team make
Data Accuracy & Integrity Random Sampling: Every sample has equal probability of being picked. Sequential Sampling: Used in destructive testing and reliability testing where higher cost is involved in testing. Samples are tested one by one sequentially until the desired results are reached. Stratified Sampling: Where there is a mixture from different machines, streams, raw material lots or process settings. Random sampling is not appropriate. It is more effective to stratify the lot based on the criteria (by machine, stream, lot or setting) and pick random samples from the stratified group.
Operational Definitions Operational Definition: An Operational Definition is a description whereby those affected will have a common understanding such that all parties will have no ambiguity over what is being measured