Download
1 / 24
240 likes | 257 Vues
15-minute Introduction to PROMIS. Ron D. Hays, Ph.D UCLA Division of General Internal Medicine & Health Services Research. Roundtable Meeting on Measuring Burden of Illness November 10, 2010 (1:50-2:05 pm) RTI, Washington, DC. What is PROMIS?.

E N D
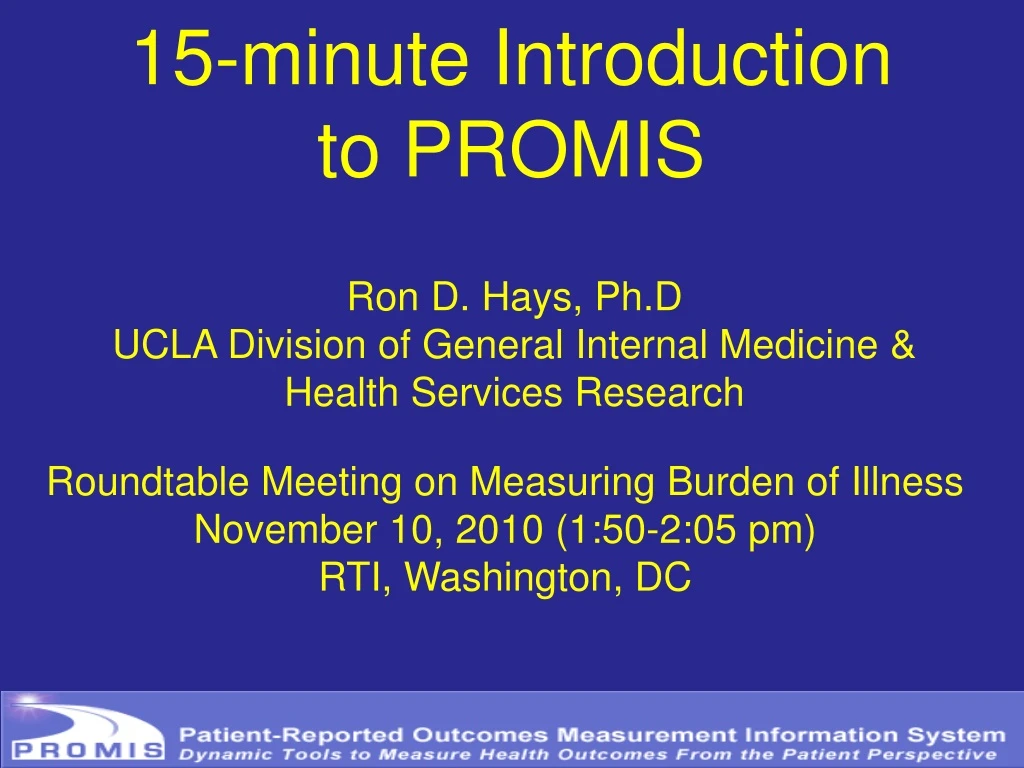
15-minute Introduction to PROMIS Ron D. Hays, Ph.D UCLA Division of General Internal Medicine & Health Services Research Roundtable Meeting on Measuring Burden of Illness November 10, 2010 (1:50-2:05 pm) RTI, Washington, DC
What is PROMIS? • A nine-year $70 million commitment of NIH to improve and standardize measurement of patient-reported outcomes (PROs) • Self-reported health • An answer to the PRO “Tower of Babel”
Rosetta Stone The
PROMIS-1 Network: 2004-2009 ● University of Washington ● StoneyBrook Northwestern ♥ ● University of Pittsburgh ●NIH ● Stanford UNC –Chapel Hill ● ● Duke University* ♥Coordinating Center
CAT Short Form Instruments Existing Items Literature Review Patient Focus Groups Expert Input and Consensus Newly Written Items Item Pool Expert Review Translation Cognitive Testing Secondary Data Analysis Questionnaire administered to large representative sample Psycho- metric Testing Item Bank (IRT-calibrated items)
Item 1 Item 2 Item 3 Item 4 Item 5 Item 6 Item 7 Item 8 Item 9 Item n 50 Physical Functioning Item Bank • Are you able to get in and out of bed? • Are you able to stand without losing your balance for 1 minute? • Are you able to walk from one room to another? • Are you able to walk a block on flat ground? • Are you able to run or jog for two miles? • Are you able to run five miles?
Q Q Q Q Q Q Q Q Q Q Q Q Q Q Q Q Q Likely “I get tired when I run a marathon” Unlikely “I get tired when I get out of a chair” Q Q Q Q Q Q Q Q Q Q Q Q Q Q Q Q Q Q Q Q Q Q Q Q Q Q Q Q Q Q Q Q Q Q Item Location Interpretation Person Fatigue Score Low High
Interpretation Aids PRO Bank Person Score Low High 30 40 50 60 70 M = 50, SD = 10 T = (z * 10) + 50
Example of high fatigue Fatigue Score=60 Low High 30 40 50 60 70 This patient’s fatigue score is 60, significantly worse than average (50). People who score 60 on fatigue tend to answer questions as follows:…”I have been too tired to climb one flight of stairs: VERY MUCH …”I have had enough energy to go out with my family: A LITTLE BIT
Example of low fatigue Fatigue Score=40 Low High 30 40 50 60 70 This patient’s fatigue score is 40, significantly better than average (50). People who score 40 on fatigue tend to answer questions as follows: …”I have been too tired to climb one flight of stairs: SOMEWHAT …”I have had enough energy to go out with my family: VERY MUCH
Computerized Adaptive Testing (CAT) • Select questions based on a person’s response to previously administered questions. • Iteratively estimate a person’s standing on a domain (e.g., fatigue, depressive symptoms) • Administer most informative items • Desired level of precision can be obtained using the minimal possible number of questions.
Best Item-I felt depressed Beginning of CAT T-Score = 50 SE = 10
Next Best Item-I felt like a failure • I felt depressed • Never • Rarely • Sometimes • Often • Always T-Score = 52 SE = 4
Next Best Item-I felt worthless • I felt like a failure • Never • Rarely • Sometimes • Often • Always T-Score = 53 SE = 3
Next Best Item-I felt helpless • I felt worthless • Never • Rarely • Sometimes • Often • Always T-Score = 55 SE = 2
I felt helpless • Never • Rarely • Sometimes • Often • Always T-Score = 55 SE = 2
measurement precision (standard error) 0.5 SF-12 items 0.4 SF-36 items 0.3 HAQ items 0.2 CAT 10 items Full Item Bank 0.1 rheumatoid arthritis patients representativesample -4 -3 -2 -1 0 +1 +2 normed theta values US-Representative Sample CAT assessments can achieve higher precision than fixed forms SE = 0.32rel = 0.90 SE = 0.22rel = 0.95 Rose et al, J Clin Epidemiol 2007 (accepted)
Thank you www.nihpromis.org