Placings By Traits
170 likes | 345 Vues
1. 2. 4. 3. 1. 2. 4. 3. Placings By Traits. Official Placing: 4 - 1 - 2 - 3 Cuts: 4 - 3 - 6. Muscle: 2-4-1-3 Finish: 1-4-2-3 Capacity: 4-1-2-3. Structure: 4-1-2-3 Balance: 2-4-1-3. Question: which one would have best calves?. Question!.

Placings By Traits
E N D
Presentation Transcript
1 2 4 3
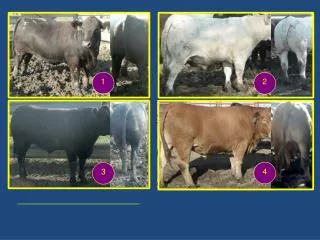
1 2 4 3 Placings By Traits Official Placing: 4 - 1 - 2 - 3 Cuts: 4 - 3 - 6 Muscle: 2-4-1-3 Finish: 1-4-2-3 Capacity: 4-1-2-3 Structure: 4-1-2-3 Balance: 2-4-1-3
Question! • EPD - ___________________; a predictor of future performance!
Expected Progeny Differences Cattle Selection Using Genetic Data Nick Nelson Blue Mountain Community College
Background • EPD’s were started in the 1970’s and were established on all Beef Breeds of cattle by 1984 • Before EPD’s, Cattlemen used “Herd Ratios” as a record keeping system on their cattle. • Herd Ratio’s cannot be measured from one ranchers cattle to another ranchers cattle, because of differences in genetics, climate, and region.
EPD’s are the most accurate means of records that we have! • Expected Progeny Differences are based on the “3 P’s” • Pedigree—The parents performance • Progeny—The offsprings performance • Performance—The individual’s performance Data is collected from all animals among the 3 P’s to make an EPD
The Gist of EPD’s • Each breed has their own set of standards and breed averages • You cannot compare data of a Hereford bull and data from a Angus Bull
The Gist of EPD’s • Data can only be measured between animals in the same breed • Artificial Insemination has assisted in the use of EPD’s, because sires are frequently used by many people and have thousands of offspring each year making genetic data very accurate.
Typical EPD’s • Birth Weight—measured in pounds • Weaning Weight—pounds • Yearling Weight—pounds • Milk—pounds • Total Maternal—pounds (1/2 of WW + Milk) • Stayability—years • Gestation—days • Intramuscular fat • Rib Eye Area – size of the ribeye in square inches • Backfat – amount of backfat in inches
Example The Red Angus Breed Average of all animals within the breed are: BW WW YW Milk TM -0.3 32 61 17 33 You Decide to use a Red Angus bull with EPD’s of: BW WW YW Milk TM 2.0 40 78 15 31 The EPD’s tell you that compared to the Breed Avg. your bull is going to have calves that are going to be 2.3 pounds heavier at birth (2.0-0.7). Calves that are 8 pounds heavier at weaning, and 17 pounds heavier at Yrlg, and your bull should have daughters that produce 2 pounds less milk than the average
Selection Quiz BW WW YW Milk Bull A: 4.5 38 59 16 Bull B: -0.5 32 47 21 Which Bull will you choose for Heifers? Which Bull will you choose for growth?
Cattle Auction using EPD’s • Students break into teams of two-Ranch Manager and the Ranch Owner • Students will get a loan from the Instructor to buy bulls (Do not show your loan to someone else, they may outbid you!) • Students will select bulls they want to buy based on the bulls phenotype (physical appearance) and genotype (genetic data) • Each Bull will be given a dollar amount based on their performance and semen sales—Only one Jackpot bull and one loser bull
Bull #1 NYACK Bull #2 LOGAN BW WW YW Milk -1.0 22 45 20 BW WW YW Milk -1.0 25 41 23
Bull #3 VAQUERO Bull #4 DRIFTER BW WW YW Milk -.9 34 44 14 BW WW YW Milk -2.1 24 48 13
Bull #5 GRAND CANYON Bull #6 HIGH CAPACITY BW WW YW Milk 1.2 35 75 23 BW WW YW Milk 4.4 48 78 21
The Results • Bull 1 Generates $5000 for Ranch • Bull 2 Generates $10,500 for Ranch • Bull 3 Generates $2000 for Ranch • Bull 4 Generates $3000 for Ranch • Bull 5 Generates $25,000 for Ranch • Bull 6 Generates $1000 for Ranch • Calculate Loss or Gain dollars generated - dollars spent