Download

1 / 27
270 likes | 298 Vues
Explore ways to effectively present and visualize multidimensional and abstract data using interactive techniques. Control subsets of data from different viewpoints.

E N D
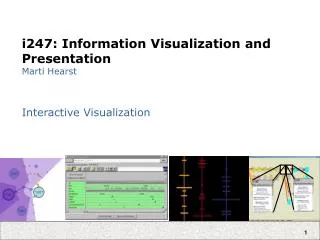
i247: Information Visualization and PresentationMarti Hearst Interactive Multidimensional Visualization
Interactive Techniques • Ask what-if questions spontaneously while working through a problem • Control the exploration of subsets of data from different viewpoints
Problem Statement • How to effectively present more than 3 dimensions of information in a visual display with 2 (to 3) dimensions? • How to effectively visualize “inherently abstract” data? • How to effectively visualize very large, often complex data sets? • How to effectively display results – when you don’t know what those results will be? Adapted from Refell, Aydelott, & Fitzpatrick
Another Statement of Goals Visualization of multidimensional data • Without loss of information • With: • Minimal complexity • Any number of dimensions • Variables treated uniformly • Objects remain recognizable across transformations • Easy / intuitive conveyance of information • Mathematically / algorithmically rigorous (Adapted from Inselberg) Adapted from Refell, Aydelott, & Fitzpatrick
Characteristics • “Data-dense displays” (large number of dimensions and/or values) • Often combine color with position / proximity representing relevance “distance” • Often provide multiple views • Build on concepts from previous weeks: • Retinal properties of marks • Gestalt concepts, e.g., grouping • Direct manipulation / interactive queries • Incremental construction of queries • Dynamic feedback • Some require specialized input devices or unique gesture vocabulary Adapted from Refell, Aydelott, & Fitzpatrick
Examples Warning: These visualizations are not easy to grasp at “first glance”! DON’T PANIC Adapted from Refell, Aydelott, & Fitzpatrick
Alternative Network Viz(Legal cases) • Network Visualization by Semantic Substrates, Shneiderman & Aris, IEEE TVCG 2006. • http://hcil.cs.umd.edu/video/2006/substrates.mpg
PaperLens • Understanding research trends in conferences using PaperLens Lee et al., CHI'05 extended abstracts • http://www.cs.umd.edu/hcil/paperlens/PaperLens-Video.mov
Highlighting and Brushing:Parallel Coordinates by Inselberg • Visual Data Detective • Free implementation: Parvis by Ledermen • http://home.subnet.at/flo/mv/parvis/
Multidimensional Detective A. Inselberg, Multidimensional Detective, Proceedings of IEEE Symposium on Information Visualization (InfoVis '97), 1997. Do Not Let the Picture Scare You!!
Inselberg’s Principles A. Inselberg, Multidimensional Detective, Proceedings of IEEE Symposium on Information Visualization (InfoVis '97), 1997 • Do not let the picture scare you • Understand your objectives • Use them to obtain visual cues • Carefully scrutinize the picture • Test your assumptions, especially the “I am really sure of’s” • You can’t be unlucky all the time!
A Detective Story A. Inselberg, Multidimensional Detective, Proceedings of IEEE Symposium on Information Visualization (InfoVis '97), 1997 • The Dataset: • Production data for 473 batches of a VLSI chip • 16 process parameters: • X1: The yield: % of produced chips that are useful • X2: The quality of the produced chips (speed) • X3 … X12: 10 types of defects (zero defects shown at top) • X13 … X16: 4 physical parameters • The Objective: • Raise the yield (X1) and maintain high quality (X2)
Multidimensional Detective • Each line represents the values for one batch of chips • This figure shows what happens when only those batches with both high X1 and high X2 are chosen • Notice the separation in values at X15 • Also, some batches with few X3 defects are not in this high-yield/high-quality group.
Multidimensional Detective • Now look for batches which have nearly zero defects. • For 9 out of 10 defect categories • Most of these have low yields • This is surprising because we know from the first diagram that some defects are ok.
Go back to first diagram, looking at defect categories. Notice that X6 behaves differently than the rest. Allow two defects, where one defect in X6. This results in the very best batch appearing.
Multidimensional Detective • Fig 5 and 6 show that high yield batches don’t have non-zero values for defects of type X3 and X6 • Don’t believe your assumptions … • Looking now at X15 we see the separation is important • Lower values of this property end up in the better yield batches
Automated Analysis A. Inselberg, Automated Knowledge Discovery using Parallel Coordinates, INFOVIS ‘99
Influence Explorer / Prosection Matrix(Tweedie et. al.) • http://www.open-video.org/details.php?videoid=5015 • Abstract one-way mathematical models: multiple parameters, multiple variables. • Data for visualization comes from sampling • Visualization of non-obvious underlying structures in models • Color coding, attention to near misses
Influence Explorer / Prosection Matrix(Tweedie et. al.) • Use the sliders to set performance limits. • Color coding gives immediate feedback as to effects of changes—both for ‘perfect’ scores and for near-misses. • Can also highlight individual values across histograms, show parallel coordinates. • Interactive querying!
Influence Explorer / Prosection Matrix(Tweedie et. al.) • In this view we can shift parameter ranges in addition to performance limits. • Red is still a perfect score—blacks miss one parameter limit, blues one or two performance limits. • Does this color scheme make sense? Would another work better?
Influence Explorer / Prosection Matrix(Tweedie et. al.) • Prosection matrix (on right) = scatter plots for pairs of parameters. • Color coding matches histograms. • Fitting tolerance region (yellow box) to acceptability (red region) gives high yield for minimum cost • Or: Make the red bit as big as possible! • This aspect closely tuned to task at hand: manufacturing and similar.
VisDB(Keim & Kriegel) • Mapping entries from relational database to pixels on the screen • Include “approximate” answers, with placement and color-coding based on relevance • Data points laid out in: • Rectangular spiral • Or, with axes representing positive/negative values for two selected dimensions • Or, group dimensions together (easier to interpret than very large number of dimensions) Adapted from Refell, Aydelott, & Fitzpatrick
from http://infovis.cs.vt.edu/cs5984/students/VisDB.ppt Adapted from Refell, Aydelott, & Fitzpatrick
VisDB - Relevance • Relevance calculation based on “distance” of each variable from query specification • Distance calculation depends on data type • Numeric: mathematical • String: character/substring matching, lexical, phonetic?, syntactic? • Nominal: predefined distance matrix • Possibly other “domain-specific” distance metrics Adapted from Refell, Aydelott, & Fitzpatrick
VisDB – Screen Resolution • Stated screen resolution seems reasonable by today’s standards:19 inch display, 1024x1280 pixels= 1.3 million data points • However, controls take up a lot of space! Adapted from Refell, Aydelott, & Fitzpatrick
from http://www1.ics.uci.edu/~kobsa/courses/ICS280/notes/presentations/Keim-VisDB.ppt Adapted from Refell, Aydelott, & Fitzpatrick
Limitations and Issues • Complexity • Abstract data • These visualizations are oriented toward abstract data • For “naturally” two or three-dimensional data (things that vary over time or space, e.g., geographic data) visualizations which exploit those properties may exist and be more effective Adapted from Refell, Aydelott, & Fitzpatrick