Download

1 / 54
540 likes | 561 Vues
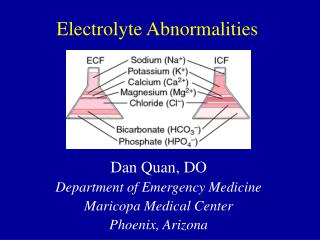
List the causes and clinical implications of various electrolyte abnormalities Describe ECG changes in potassium and calcium. Hypokalemia. Serum level below 3.5–5.0 mEq/L Caused by vomiting, diarrhea, diuretics, gastric suctioning ,Hypomagnesemia Muscle weakness, polyuria

E N D
List the causes and clinical implications of various electrolyte abnormalities • Describe ECG changes in potassium and calcium
Hypokalemia • Serum level below 3.5–5.0 mEq/L • Caused by vomiting, diarrhea, diuretics, gastric suctioning ,Hypomagnesemia • Muscle weakness, polyuria • Digitalis can take advantage and cause Torsades de pointes
Hypokalemia • ECG Changes • ST segment depression • T waves flatten or join U waves • U waves get larger than Ts • QT interval appears to lengthen • PR interval increases
Hypokalemia: ST depression with prominent T (actually U) and prolonged QT when K<2.5-3 Flat T with K~3
Hyperkalemia • Most common cause is renal failure • Sinus node can quit at 7.5 mEq/L • VF or asystole at 10–12 mEq/L
Hyperkalemia: T wave in hyperkalemia is typically tall and narrow, but does not have to be tall (may be just narrow and peaked pulling ST segment).
Hyperkalemia Tall T waves with a narrow base QRS widens
Calcium • Hypercalcemia: Short QT interval • Hypocalcemia: Prolonged QT interval
Hypocalcemia: Long QT that is due to a long ST segment, which is different from long QT due to congenital long QT syndrome, drugs, or hypokalemia. T wave is not wide, there is no T wave abnormality.
Hypercalcemia: short QTc <390 ms. No significant ST or T wave abnormality
The QT Interval • Measured from the start of the QRS complex to the end of the T wave • Measures the total ventricular activity: “refractory time” • QTc is corrected for rate
139 The QT/QTc Table
Prolonged QT Etiologies • • Familial long QT Syndrome • • Congestive Heart Failure • • Myocardial Infarction • • Hypocalcemia • • Hypomagnesemia • • Type I Antiarrhythmic drugs • • Myocarditis
Shortened QT Etiologies • • Digoxin (Digitalis) • • Hypercalcemia • • Hyperkalemia
Hypomagnesemia is not associated with characteristic or specific ECG findings It is associated with a non-specific prolongation of QT and/or QRS intervals, and is often associated with hypokalemia and hypocalcemia. Therefore, changes related to the latter 2 abnormalities may be seen.
Pathologic Q Waves I 28
Progression of Myocardial Infarction During MI the ECG often evolves through three stages: Ischemia Injury Infarction 29
Identification of MI Reciprocal changes seen on 12-lead ECG may assist with distinguishing between MI and conditions that mimic it 30
View of Inferior Heart Wall • Leads II, III, aVF • Looks at inferior heart wall • Looks from the left leg up
View of Lateral Heart Wall • Leads I and aVL • Looks at lateral heart wall • Looks from the left arm toward heart *Sometimes known as High Lateral*
View of Lateral Heart Wall • Leads V5 & V6 • Looks at lateral heart wall • Looks from the left lateral chest toward heart
View of Anterior Heart Wall • Leads V3, V4 • Looks at anterior heart wall • Looks from the left anterior chest
View of Septal Heart Wall • Leads V1, V2 • Looks at septal heart wall • Looks along sternal borders
Posterior Ischemia, Injury, Infarction Can be identified through leads V7, V8 and V9 38
Right Ventricular Ischemia, Injury, Infarction Can be identified using leads V3R, V4R, V5R, V6R 39
Reciprocal ST segment depression Acute ST segment elevation
Pericarditis • Signs and Symptoms • Chest pain, dyspnea, tachycardia, fever, weakness, chills • Chest pain sharp, radiating to back, neck, jaw • Made worse by lying flat, twisting • Made better by leaning forward
Pericarditis • Often pleuritic pain, worse on inhalation • Pain can last for hours or days • Pericardial friction rub • Heard over left lower sternal border
Pericarditis ECG Criteria • ST segment elevation • Concave in all leads • T wave elevation • PR depression
ECG Criteria: APE • Deep S in Lead I • Abnormal Q in Lead III • Inverted T in Lead III