Download
1 / 20
250 likes | 685 Vues
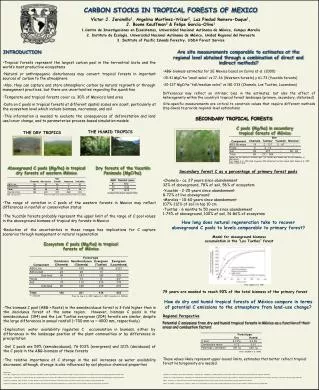
Carbon Stocks and Fluxes in Forests Ecosystems. Ken Byrne, Forest Ecosystem Research Group, Department of Environmental Resource Management, University College Dublin. Greenhouse Gas Balances of Biomass and Bioenergy Systems , Sustainable Energy Ireland, 20 th November 2003. Content.

E N D
Carbon Stocks and Fluxes in Forests Ecosystems Ken Byrne, Forest Ecosystem Research Group, Department of Environmental Resource Management, University College Dublin. Greenhouse Gas Balances of Biomass and Bioenergy Systems, Sustainable Energy Ireland, 20th November 2003
Content • Forests and Carbon • UNFCCC and Kyoto Protocol • Carbon sequestration in Irish forests • Conclusions
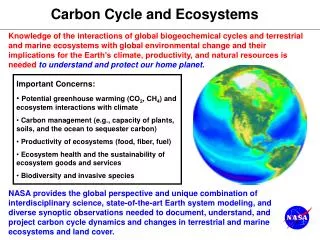
Forests and the global carbon cycle • Carbon pools: • Oceans: 39,120 Gt Carbon • Atmosphere: 750 Gt Carbon • Land vegetation: 550 Gt Carbon (65% in forests) • Soil and organic matter: 1500 Gt Carbon (53% in forests) 1 Gt = 109 t C
Background • UNFCCC • GHG inventories • Conservation and enhancement of sinks • Kyoto Protocol • Agreed GHG reduction targets • Ireland, limit emissions to 1990 + 13% by 2008-2012 • ‘Kyoto forests’ • Article 3.3: C stock changes due to afforestation, reforestation and deforestation since 1990 • Article 3.4: Forest Management
Background cont. • Marrakesh Accords • ‘Kyoto forests’ • Article 3.3: no limit, fully credited • Article 3.4: Forest Management: 50,000t C/year • Para. 21 “Each Party included in Annex I shall account for all changes in the following carbon pools: above-ground biomass, below-ground biomass, litter, dead wood, and soil organic carbon. A Party may choose not to account for a given pool in a commitment period, if transparent and verifiable information is provided that the pool is not a source.”
CO2 sinks Photosynthesis (GPP) CO2 sources Respiration Forest growth Respiration Litterfall Decomposition soils Net ecosystem exchange (GPP - total respiration) Carbon stocks/pools • Above-ground biomass • Stemwood • Branchwood • Bark • Foliage • Below-ground biomass • Coarse roots • Fine roots • Stumps • Litter • Coarse woody debris • Soil organic carbon
Managed as a carbon sink a. Establishment b. Full vigour c. Mature Phase d. Longterm equilibrium Managed as commercial forest Periodic felling indicated by arrows Over several rotations carbon stocks neither incrase of decrease Accumulation balanced by removals for wood products, bioenergy etc Carbon Stock Dynamics in Forest Ecosystems
National level Upscaling Plot level Irish Forests and Carbon: Information Needs • How does the forest C balance function ? • What is the C Stock ? • How is it changing ? • How will it change in the future ? • What are the factors controlling it ? • Soil, species, management etc.
Pools and fluxes represented in the C-Flow model product decay atmospheric CO2 carbon fixation wood products thinning woody biomass non-woody biomass harvesting mortality, thinning & harvest residues woody litter non-woody litter Transfer of residues to soil Litter & soil decomposition soil organic matter Byrne & Milne (in prep.)
Inputs to the Model • Afforestation data 1906-2002. • Extrapolated to 2012 using average annual rate during 1988-2000. • 100, 75, 50 and 25% achievement of forest strategy • Areas reduced by 15% to allow for roads etc. • Species categories and Yield Classes: • Sitka spruce pre 1990 YC 16 post 1990 YC 20 • Other conifers Lodgepole pine YC 8 • Broadleaves Beech YC 6
C stocks and sequestration in Irish forests 2002 C stock (M t) Trees 19.1 Soil 13.9 Products 3.3 Litter 1.4 Total 37.7 C sequestration (M t) Trees 0.7 Soil 0.06 Products 0.12 Litter 0.51 Total 1.39
2008 2012 Cumulative C sequestration in Article 3.3 forests 0.95 M t C yr-1
Cumulative C sequestration in Article 3.3 forests: effect of afforestation rate 2008 2012
Average amount of C sequestered per year during 2008-2012 in Article 3.3 forests Scenario Mt C Mt CO2 BAU 0.95 3.48 100% 1.01 3.7 75% 0.93 3.41 50% 0.85 3.12 25% 0.78 2.86
Irelands Kyoto target 1990 emissions 53.74 mt CO2 equiv. + 13% 60.74 mt CO2 equiv. BAU (+ 37.3%) 73.79 mt CO2 equiv. Need to reduce emissions by 13.05 mt CO2 equiv. yr-1
Contribution of Article 3.3 forests to meeting Irelands Kyoto target Scenario % contribution BAU 27 100% 28 75% 26 50% 24 25% 22
Conclusions • Forests can play an important role in reducing GHG emissions. • This is only part of the solution, fossil fuel emissions need to be tackled. • National Forest Inventory is vital. • Need for national data on C cycling in forests. • CH4 and N2O ? • Forest residues can provide an indigenous energy source and help to reduce GHG emissions.