Download
1 / 23
230 likes | 417 Vues
Electro-Optic Monitor of the Bunch Longitudinal Profile. David Walsh, University of Dundee Steven Jamison, Allan Gillespie, Mateusz Tyrk, Rui Pan, Thibaut Lefevre. Outline of Talk. Project Aims EO Transposition System Design Progress System parameters determination

E N D
Electro-Optic Monitor of the Bunch Longitudinal Profile David Walsh, University of Dundee Steven Jamison, Allan Gillespie, Mateusz Tyrk, Rui Pan, Thibaut Lefevre
Outline of Talk • Project Aims • EO Transposition System • Design Progress • System parameters determination • Bunch-probe misalignment effects • Next Steps
CLIC Requirement CLIC project targets • Non-invasive • Single shot • Diagnostic target resolution ~20fs rms (Bunches ~150fs rms) EO diagnostics: (encoding of Coulomb field into a laser intensity) Advantages • Scales well with high beam energy • Particle methods get impractical (size, beam dumps) • Non-destructive • Bunches can still be used • Live feedback Challenges to be met • Unreliability, maintenance and cost of suitable ultrashort pulse laser systems • Temporal resolution We aim to improve on the resolution and the robustness of EO diagnostics
EO Transposition System EO Transposition Coulomb field GaP ~800nm 5ns 1mJ 1000x Amplification (NCOPCPA) Measurement 532nm 10mJ 10ns ¼λ plate & polariser Nanosecond Laser System Stretcher BBO Comp- ressor DIY GRENOUILLE Beam dump Beam dump Pulse Evolution nanosecond probe recompressed “transposed pulse” stretched amplified amplitude time Nanosecond laser brings reliability Full spectral amplitude and phase measured via FROG technique Coulomb field (bunch profile) calculated via time-reversed propagation of pulse David Walsh, University of Dundee. CLIC Workshop 2014
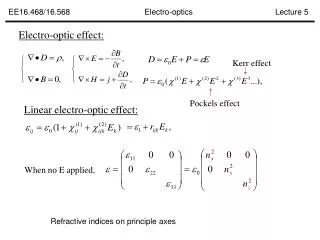
Physics of EO Transposition Standard Description Pockels effect induces a phase change which is detected via polarization measurements This is not true for short bunches! More Rigorous Description – nonlinear frequency mixing Coulomb spectrum shifted to optical region Coulomb pulse temporally replicated in optical pulse circa 20nm S.P. Jamison Opt. Lett. v31 no.11 p1753 optical field envelope Consider a single-frequency probe and short Coulomb field “pulse” Optical field Coulomb field few mm Intensity Intensity Intensity ~50fs tens μm t ν λ 800nm this is already a potentially useful diagnostic!
Characterisation of Transposed Pulse Considerations: * needs to be single shot * autocorrelation not unambiguous – no shorter reference pulse available * low pulse energy Solution: Grenouille(frequency resolved optical gating), astandard and robust optical diagnostic. Retrieves spectral intensity and phase from spectrally resolved autocorrelation. What we want to know <-Fourier-> = “Carrier” frequency Can’t measure Can be retrieved! Spectrum Spectral Phase • The most sensitive “auto gating” measurement • Self-gating avoids timing issues (no need for a fs laser) • Requires minimum pulse energy of > 10 nJ • Commercial systems offer > 1 μJ
Investigation into EO Transposition • Verification of EO Transposition • Investigation of measurement thresholds / signal-to-noise ratios • Necessary for defining and verifying system parameters Femtosecond laser-based test bed Austonswitch THz source mimics Coulomb field. Well-characterised spectral and temporal profile. Δν ~44GHz Δ t ~10ps FWHM Femtosecond laser pulse spectrally filtered to produce narrow bandwidth probe
Measurement of Transposed Spectrum Output characteristics (4mm ZnTe) Input pulse characteristics Optical probe length Δt ~ 10ps Optical probe energy S ~ 28nJ THz field strength max E ~ 132kV/m | |2 Total energy ~470pJ Leaking probe Upconversion of spectrum verified
Extrapolation to CLIC parameters Scaling factors is the EO crystal length, is the nonlinear coefficient Example: “Typical” nanosecond pulse laser as probe Pulse energy 1mJ Pulse duration 10ns 100 kW Coulomb field for target CLIC bunch parameters (CDR) Bunch length 44μm Bunch charge 0.6pC 24.5 MV/m Pulse energy of ~15nJ is predicted 1μJ required for the commercial single-shot FROG, “Grenouille”
Parametric Optical Amplification • Routinely used to produce “single-cycle” optical pulses, and amplification of CEP stabilised pulses has been demonstrated • For phase matched and/or low conversion conditions phase is preserved • Small Phase and Amplitude distortions calculated (and so can be removed) • Bandwidth very broad >50THz • Stand-ins for pump and signal – picosecond laser system and Ti:Sapphirelaser Pulse spectrum maintained Pump derived from 50ps pulse laser Gain of >1000x verified Further tests awaiting Grenouille Photodiode or Spectrometer 532nm, ~300MW/cm2 α Heavily attenuated 800nm, 50fs pulse θ optic axis 20mm BBO θ = 23.81 α = 2.25
Stretcher and Compressor Design >Pump! Not possible! OK, and will not distort Conjugate Stretcher and Compressor designs 1m 0.5m GVD = 5.6x10⁶ fs2 All gratings G=1200 lines/mm Θdeviation~15° 1m Calculations indicate nanosecond level jitter has negligible effect
Testing Summary • Commercial Q-Switched laser system parameters have been confirmed • Laser has been sourced and ordered • Ancillary optics currently being assembled • Aim to test full system this year That’s not all…
Alignment Issues Early measurements of spectra often asymmetric and weak/unobservable 150μm 1.5mm Adjustment of the THz alignment could modify the observed spectral sidebands! 50cm Understanding this effect is crucial to correctly performing any EO measurement!
Non-collinear Phase Matching A natural consequence of considering nonlinear processes is that phase matching must be considered! Polarisation field set up by probe and THz (Coulomb) field: Expand fields into envelope and carrier: Then solve paraxial wave equation using Gaussian transverse profiles: = Same form as derived in NLO literature
Predicted Effect of Misalignment Phase matching efficiencies calculated in Matlab Code iterates through THz frequencies and calculates the efficiency for a range of upconversion directions 2 Consequences • Spectrally varying beam propagation angle • Beams “walk off” one another at distance or in the focus of a lens (e.g. fiber coupling)
Experimental Confirmation of Predictions • 7% difference in slopes systematic error (n(THz), focussing optics) • Confirmed predictions of model • Enabled us to produce rule-of-thumb guides
Phasematching Summary • We now have a proper understanding of the issue • Correct management of the optical beam is an essential part of any EO system • Findings have wider-ranging implications and we aim to publish conclusions soon • This could have been the cause of some difficulties with EO systems in the past! Just a little more…
Temporal Resolution EO transposition scheme is now limited by materials: phase matching, absorption, stability • Collaborative effort with MAPS group • at the University of Dundee on • development of novel EO materials • Potential to produce an enhancement of nonlinear processes through metallic nanoparticles • THz field-induced second harmonic enhancement being investigated • Attempts to characterise second harmonic from silver nanoparticles began in Dundee yesterday! • A key property of the EO Transposition scheme may be exploited • EOT system retrieves the spectral amplitude and phase • At frequencies away from absorptions, etc., the spectrum should still be faithfully retrieved • Potential to run two“tried and tested” crystals with complementary response functions side-by-side to record FULL spectral information!
Compositing Spectral Data Theoretical response functions Compositing Methodology Capturetwo sets of data using both crystals Alignretrieved amplitude and relative phase where data overlaps (0 – 4 THz) Patche.g. use ZnTe spectrum with GaP data patching 4 - 7.5 THz region Initial numerical simulations very promising! But not ready for dissemination.
Next Steps • Completion and evaluation of full EO Transposition system • Using lab based lasers • Pursuing options to test at an accelerator • Ramping up efforts to improve bandwidth • Multi crystal • Enhance nonlinear effects (MAPS @ Dundee) • Engineer working system towards being a “turn-key” measurement • Expand to multiple bunch monitor • Micro bunch evolution within macro bunch
EOT System Layout David Walsh, University of Dundee. CLIC Workshop 2014