Download
1 / 17
170 likes | 196 Vues
Learn about simple events, theoretical probability, and experimental probability through practical examples. Understand the probability of outcomes in various scenarios.

E N D
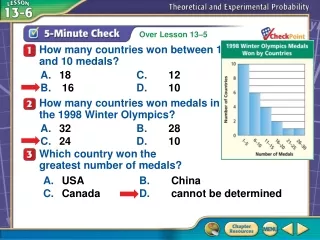
A B C D How many countries won between 1 and 10 medals? A. 18 C. 12 B. 16 D. 10 How many countries won medals in the 1998 Winter Olympics? A. 32 B. 28 C. 24 D. 10 Which country won the greatest number of medals? A. USA B. China C. Canada D. cannot be determined 5-Minute Check 1
You have already simplified ratios. (Lesson 6–1) • Find the probability of simple events. • Predict the actions of a larger group. Then/Now
outcomes Possible result of a probability experiment • simple event • probability • sample space • random • theoretical probability • experimental probability One outcome or a collection of outcomes. The ratio of the number of ways a certain event can occur to the total number of possible outcomes The set of all possible outcomes Outcomes occur at random if each outcome is equally likely to occur (it is not fixed or has been manipulated) What should occur in a probability experiment What actually occurs in a probability experiment Vocabulary
Answer: Find Probability Suppose a number cube is rolled. What is the probability of rolling a 4 or a 5? There are 2 numbers on the number cube that are a 4 or a 5: 4 and 5. There are 6 possible outcomes: 1, 2, 3, 4, 5, and 6. Example 1
A B C D A.AnsA B.AnsB C.AnsC D.AnsD Suppose a number cube is rolled. What is the probability of rolling a number that is divisible by 3? Example 1 CYP
Find Probability Suppose that two number cubes are rolled. Find the probability of rolling two identical numbers. Make a table showing the sample space when rolling two number cubes. Example 2
Answer: Find Probability There are 6 outcomes in which the two numbers are identical. Example 2
A B C D A. B. C. D. Suppose that two number cubes are rolled. Find the probability of rolling two numbers whose sum is 8. Example 2 CYP
Find Experimental Probability A coin was tossed 40 times and heads came up 18 times. Find the experimental probability of getting tails for this experiment. Then compare the experimental probability with the theoretical probability. Example 3
Find Experimental Probability Answer: So, tossing tails in the experiment occurred more often than expected. Example 3
A B C D A. B. C. D. BASKETBALLBrian is shooting baskets with a basketball. He makes 13 shots and misses 9 shots. Determine the experimental probability of Brian making a shot. Example 3 CYP
Make a Prediction SPORTS Miss Newman surveyed her class to see which sports they preferred watching. 44% preferred football, 28% basketball, 20% soccer, and 8% tennis. Out of 560 students in the entire school, how many would you expect to say they prefer watching basketball? Understand You know that 28% prefer basketball. You need to find how many students out of 560 prefer basketball. Plan Use the percent proportion to find 28% of 560. Example 5
part percent whole Make a Prediction Solve The percent is 28% and 560 is the whole. Let a represent the part. Example 5
Make a Prediction Answer: You can expect about 157 students to say they prefer watching basketball. CheckEstimate: 28% is about 25%. 25% of 600 is 150. So, 157 is reasonable. Example 5
A B C D COLORS The students in an art class were surveyed about their favorite color. 32% preferred blue, 29% preferred red, 23% preferred yellow, and 16% preferred green. Out of 450 students in the entire school, how many would you expect to say they prefer red? A. about 6 B. 29 C. about 131 D. 144 Example 5