Understanding Linear Relationships with Rate of Change in Graphs
180 likes | 283 Vues
This lesson focuses on identifying proportional and nonproportional relationships using graphs and tables. Key concepts include constant rate of change, direct variation, and constant of variation. Examples demonstrate finding the rate of change and interpreting its meaning in real-life scenarios.

Understanding Linear Relationships with Rate of Change in Graphs
E N D
Presentation Transcript
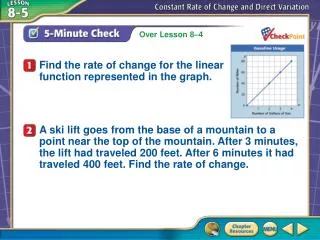
A B C D Find the rate of change for the linear function represented in the graph. A ski lift goes from the base of a mountain to a point near the top of the mountain. After 3 minutes, the lift had traveled 200 feet. After 6 minutes it had traveled 400 feet. Find the rate of change. 5-Minute Check 1
You have already identified proportional and nonproportional relationships in tables and graphs. (Lesson 6–4) • Identify proportional and nonproportional relationships by finding a constant rate of change. • Solve problems involving direct variation. Then/Now
linear relationship Relationships that have straight line graphs • constant rate of change • direct variation • constant of variation The rate of change between any two data points in a linear relationship is the same or constant A special type of linear equation that describes rate of change. A relationship such that as x increases in value, y increases or decreases at a constant rate. The rate of change in an equation y = kx, represented by k Vocabulary
Find a Constant Rate of Change SAVINGSThe graph shows the amount of money in Yen’s savings account each week. Find the constant rate of change. Then interpret its meaning. Step 1 Choose any two points on the line, such as (1, 20) and (4, 80). (1, 20) → 1 week, $20 (4, 80) → 4 weeks, $80 Example 1
Find a Constant Rate of Change Step 2 Find the rate of change between the points. Answer: Yen’s savings account is increasing at a rate of $20 per week. Example 1
A B C D The graph shows the amount of money in Naomi’s savings account each week. Which statement describes the rate of change? A. increasing at a rate of $15/week B. decreasing at a rate of $15/week C. increasing at a rate of $30/week D. decreasing at a rate of $30/week Example 1
Use Graphs to Identify Proportional Linear Relationships CYCLINGThe graph shows distances that a cyclist rides. Determine if there is a proportional linear relationship between the time and distance. Example 2
Use Graphs to Identify Proportional Linear Relationships Answer: The ratios are different, so this is not a proportional relationship. Example 2
A B C D The graph shows a baby’s weight gain. Determine if there is a proportional relationship between time and weight. A. Yes, the ratio of weight to weeks is always the same. B. Yes, the ratio of weight to weeks is not always the same. C. No, the ratio of weight to weeks is always the same. D. No, the ratio of weight to weeks is not always the same. Example 2
Use Direct Variation to Solve Problems A. LANDSCAPINGAs it is being dug, the depth of a hole for a backyard pond is recorded in a table. Write an equation that relates time and hole depth. Step 1 Find the value of k using the equation y = kx. Choose any point in the table. Then solve for k. y= kx Direct variation equation 8 = k(10) Replace y with 8 and x with 10. Example 3A
Divide each side by 10. Simplify. Use Direct Variation to Solve Problems Step 2 Use k to write an equation. y = kx Direct variation y = 0.8x Replace k with 0.8. Answer:y = 0.8x Example 3A
Divide each side by 0.8. Simplify. Use Direct Variation to Solve Problems B.LANDSCAPINGAs it is being dug, the depth of a hole for a backyard pond is recorded in a table. Predict how long it will take to dig a depth of 36 inches. y= 0.8x Write the direct variation equation. 36 = 0.8x Replace y with 36. Answer: 45 minutes Example 3B
A B C D A. BUSINESS The graph shows the number of frequent customer points a bookstore customer receives for each dollar spent in the store. Write an equation that relates the spending s and the points p. A.p = 5s B.p = 2s C.s = 5p D.s = 2p Example 3
A B C D B. BUSINESS The graph shows the number of frequent customer points a bookstore customer receives for each dollar spent in the store. Predict how many points a customer receives for a purchase of $34.40. A.164 B.172 C.204 D.220 Example 3