Quantified Approach to Fraud Detection: Statistical Methods and Key Metrics
This overview presents a quantified methodology for detecting fraud patterns through statistical analysis. It emphasizes the importance of understanding the differences between population and groups, utilizing techniques like Chi-Square and Kolmogorov-Smirnov tests. The analysis includes a focus on significant outliers, transaction counts, and amounts, using software for number crunching. With insights into the "significant few" and common fraud characteristics, practitioners will gain knowledge of metrics and tools essential for effective fraud detection.

Quantified Approach to Fraud Detection: Statistical Methods and Key Metrics
E N D
Presentation Transcript
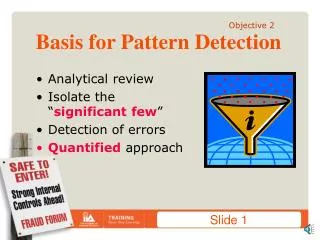
Objective 2 Basis for Pattern Detection • Analytical review • Isolate the “significant few” • Detection of errors • Quantified approach
Objective 2 Understanding the Basis • Quantified Approach • Population vs. Groups • Measuring the Difference • Stat 101 – Counts, Totals, Chi Square and K-S • The metrics used
Objective 2a Quantified Approach • Based on measureable differences • Population vs. Group • “Shotgun” technique
Objective 2a Detection of Fraud Characteristics • Something is different than expected
Objective 2b Fraud patterns • Common theme – “something is different” • Groups • Group pattern is different than overall population
Objective 2c Measurement Basis • Transaction counts • Transaction amounts
Objective 2d A few words about statistics • Detailed knowledge of statistics not necessary • Software packages do the “number-crunching” • Statistics used only to highlight potential errors/frauds • Not used for quantification
Objective 2d How is digital analysis done? • Comparison of group with population as a whole • Can be based on either counts or amounts • Difference is measured • Groups can then be ranked using a selected measure • High difference = possible error/fraud
Objective 2d Histograms • Attributes tallied and categorized into “bins” • Counts or sums of amounts
Objective 2d Two histograms obtained • Population and group
Objective 2d Compute Cumulative Amount for each
Objective 2d Are the histograms different? • Two statistical measures of difference • Chi Squared (counts) • K-S (distribution) • Both yield a difference metric
Objective 2d Chi Squared • Classic test on data in a table • Answers the question – are the rows/columns different • Some limitations on when it can be applied
Objective 2d Chi Squared • Table of Counts • Degrees of Freedom • Chi Squared Value • P-statistic • Computationally intensive
Objective 2d Kolmogorov-Smirnov • Two Russian mathematicians • Comparison of distributions • Metric is the “d-statistic”
Objective 2d How is K-S test done? • Four step process • For each cluster element determine percentage • Then calculate cumulative percentage • Compare the differences in cumulative percentages • Identify the largest difference
Objective 2e Classification by metrics • Stratification • Day of week • Happens on holiday • Round numbers • Variability • Benford’s Law • Trend lines • Relationships (market basket) • Gaps • Duplicates
Objective 2d - KS Kolmogorov-Smirnov
Objective e Auditor’s “Top 10” Metrics • Outliers / Variability • Stratification • Day of Week • Round Numbers • Made Up Numbers • Market basket • Trends • Gaps • Duplicates • Dates
Objective 2 Understanding the Basis • Quantified Approach • Population vs. Groups • Measuring the Difference • Stat 101 – Counts, Totals, Chi Square and K-S • The metrics used
Objective 2 - Summarized • Understand why and how • Understand statistical basis for quantifying differences • Identify ten general tools and techniques • Understand examples done using Excel • How pattern detection fits in Next are the metrics …