Download
1 / 35
350 likes | 520 Vues
Infezione da HIV: Report Epidemiologico e nuove manifestazioni d’esordio. Quali gli scenari futuri ? Gianni Di Perri Clinica e Dipartimento Clinico di Malattie Infettive Università degli Studi di Torino Ospedale Amedeo di Savoia. COMPETENZA IMMUNITARIA. CD4+ / L.

E N D
Infezione da HIV: Report Epidemiologico e nuove manifestazioni d’esordio. Quali gli scenari futuri ? Gianni Di Perri Clinica e Dipartimento Clinico di Malattie Infettive Università degli Studi di Torino Ospedale Amedeo di Savoia
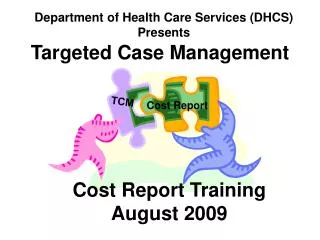
COMPETENZA IMMUNITARIA CD4+ / L L’Evoluzione dell’Infezione da HIV in Assenza di Terapia FASE ASINTOMATICA 200 / L AIDS TEMPO (ANNI)
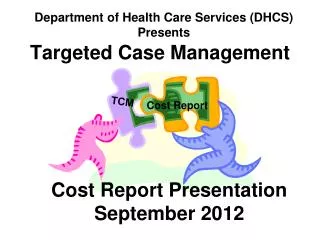
DECREASING MORTALITY AND HAART IN HIV INFECTION (JAN 1994-JUNE 1997) Palella et al. NEJM 1998
Anni Diagnosticati (rdn) Decessi Tasso di Letalità 1995 2000 2001 2002 2003 2004 2005 5653 1949 1807 1753 1718 1602 1162 3804 428 349 297 286 207 103 67.3 22.0 19.3 17.0 16.9 13.2 9.0 Distribuzione annuale dei casi di AIDS, dei decessi e del tasso di letalità Suligoi B, Boros S, Camoni L, Lepore D, Ferri M, Roazzi P. Dati COA, Dicembre 2005
Anni Lombardia Lazio E.Romagna Toscana Piemonte Liguria Campania 1996 2000 2001 2002 2003 2004 2005 4143 4407 4795 5160 5554 5931 6204 2035 2166 2355 2548 2760 2908 2959 1335 1157 1253 1340 1483 1596 1631 809 915 1002 1092 1183 1267 1321 919 880 969 1048 1098 1183 1246 728 796 864 912 972 1035 1074 590 786 853 912 971 1019 1042 + 49.7% + 45.4% + 22.2% + 63.3% + 35.6% + 47.5% + 76.6% Suligoi B, Boros S, Camoni L, Lepore D, Ferri M, Roazzi P. Dati COA, Dicembre 2005 Distribuzione annuale dei casi prevalenti di AIDS, per Regione di residenza
0.8 0.8 0.9 5.8 1.3 2.1 3.5 3.3 2.6 2.2 3.0 1.6 0.9 2.8 1.5 1.1 0.8 2.5 0.9 1.7 Anno 2005: Tasso di Incidenza di AIDS/100.000 per Regione di Residenza
Distribuzione % dei casi di AIDS per Area e per Periodo <1994 94-95 96-97 98-99 00-01 02-03 04-05 Italia Africa Asia EU.Occ. EU.Orie. N.Am. S.Am. NS 97.0 0.9 0.1 0.5 0.1 0.2 0.9 0.2 95.5 1.8 0.1 0.7 0.1 0.2 1.5 0.2 93.7 2.7 0.3 0.9 0.2 0.0 1.9 0.3 88.7 5.2 0.4 0.7 0.7 0.1 3.1 1.1 85.4 8.1 0.4 0.5 0.8 0.1 2.8 1.9 84.8 8.8 0.7 0.3 1.0 0.1 3.7 0.6 81.1 10.4 1.0 0.3 1.6 0.0 4.6 1.0 Suligoi B, Boros S, Camoni L, Lepore D, Ferri M, Roazzi P. Dati COA, Dicembre 2005
Età mediana alla diagnosi di AIDS per sesso ed anno Anni M F 1990 2000 2001 2002 2003 2004 2005 31 39 39 40 40 41 41 29 35 36 36 38 38 38 Suligoi B, Boros S, Camoni L, Lepore D, Ferri M, Roazzi P. Dati COA, Dicembre 2005
<1994 94-95 96-97 98-99 00-01 02-03 04-05 Omo/bi TD TD/Omo Emof. Trasf. Etero ND 15.7 66.7 2.4 1.0 1.1 11.8 1.2 15.3 61.5 1.9 0.5 0.8 18.1 1.9 15.0 56.8 1.4 0.4 0.6 20.7 5.1 16.9 45.4 0.7 0.2 0.5 28.9 7.3 18.0 38.0 0.8 0.3 0.3 36.4 6.3 18.6 34.5 0.6 0.1 0.3 39.9 6.0 19.7 30.8 0.6 0.1 0.2 42.0 6.5 Distribuzione % dei casi di AIDS per Categoria d’esposizione ed anno Suligoi B, Boros S, Camoni L, Lepore D, Ferri M, Roazzi P. Dati COA, Dicembre 2005
Frequenza relativa delle patologie d’esordio (indicative di AIDS) per anno di diagnosi <1994 94-95 96-97 98-99 00-01 02-03 04-05 Candidosi PCP Toxoplasmosi SNC MAC Altre Inf. Opport. KS Linfomi Encefalopatia da HIV WS Carc. Cervice uterina Polmonite ricorrente TB polmonare 25.3 23.0 8.5 5.7 14.4 5.1 2.9 6.9 7.6 0.1 0.2 0.5 20.9 19.2 8.3 7.2 16.0 4.6 2.9 7.0 6.5 0.4 2.9 4.1 20.0 17.9 7.8 7.1 15.2 4.5 3.7 7.5 7.3 0.6 3.9 4.6 19.6 19.3 6.3 6.8 12.5 5.2 4.9 7.0 8.7 0.6 3.8 5.3 19.6 19.3 6.5 6.7 14.3 5.7 5.1 5.4 8.6 0.6 3.7 4.6 19.4 20.2 6.3 6.3 14.2 5.3 5.2 5.8 8.8 0.5 3.1 4.9 18.7 19.4 6.9 7.1 14.5 4.1 5.4 5.8 9.6 0.4 3.0 5.1 Suligoi B, Boros S, Camoni L, Lepore D, Ferri M, Roazzi P. Dati COA, Dicembre 2005
? 234 Tripla 3493 Doppia 485 Mono 127 Terapia precedente la diagnosi di AIDS NO 62.4% Ignoto 2.6% SI 35.0% Suligoi B, Boros S, Camoni L, Lepore D, Ferri M, Roazzi P. Dati COA, Dicembre 2005
Tempo intercorso tra il 1° test HIV+ e la diagnosi di AIDS • di 6 mesi < di 6 mesi 100% 75% 50% 25% 0% 96 97 98 99 00 01 02 03 04 05 Suligoi B, Boros S, Camoni L, Lepore D, Ferri M, Roazzi P. Dati COA, Dicembre 2005
Nuove diagnosi di HIV 1985-2004 (Piemonte, Liguria, Veneto, Friuli, Trento, Bolzano, Modena, Lazio) OMO/bi Etero Altro/ND TD 100% 75% 50% 25% 0% 85 87 89 91 93 95 97 99 01 03 Suligoi B, Boros S, Camoni L, Lepore D, Ferri M, Roazzi P. Dati COA, Dicembre 2005
Casi prevalenti di infezione da HIV/AIDS in Piemonte 1,4 5400 5200 1,3 5000 casi prevalenti 4800 tasso di prevalenza 1,2 4600 4400 1,1 4200 1 4000 1999 2000 2001 2002 anni
Modalità di trasmissione dei nuovi casi di infezione da HIV. Triennio 1999-2001
Relazioni tra IST ed HIV • Le IST facilitano la trasmissione di HIV; pertanto la loro diagnosi precoce ed i l trattamento costituiscono una strategia di prevenzione dell’AIDS • Rischio di contrarre HIV: • Condilomi R.R. 6 • Uretrite R.R. 5.8 • Gonorrea R.R. 4.8 GUD R.R. 7.2 • Chlamydia R.R 3.6 • T.V. R.R 1.9
INFEZIONI SESSUALMENTE TRASMESSE Chlamydia trachomatis Candida albicans Neisseria gonorrhoeae Trichomonas vaginalis Herpes simplex 2 Treponema pallidum
The new sexual revolution HIV = STD
Istituto Superiore di Sanità Sistema di Sorveglianza Nazionale delle MST Sistema sentinella: costituito nel 1991 con 48 centri pubblici specializzati nella diagnosi e cura delle MST o o o o o o o o o o o o o o o o o o o o o o o o o o o o o o o o o o o o o o o o o o o o O Centri ginecologici o OCentri dermatologici
Infezione da HIV in pazienti con MST: sieroprevalenza per anno Sorveglianza Nazionale MST, 1991-2002 (76.108 casi)
Quali scenari, quindi ? • Nuovi pazienti da individuare soprattutto nell’area della trasmissione sessuale…….. • Pazienti che iniziano il trattamento con un profilo immunovirologico già deteriorato, e quindi con un maggior rischio di fallimento (soprattutto con minori chances di un valido recupero immunitario) • Le nostre attuali linee-guida non individuano, al momento, una strategia specifica per gli “advanced naive”
In Terapia Antiinfettiva la misura del decremento iniziale dei parametri farmacodinamici analizzabili tende a correlarsi con l’esito finale del trattamento. Una rapida riduzione di un parametro rappresentativo dell’infezione in trattamento può quindi essere intesa: Semplicemente come un indicatore precoce di efficacia, la cui verifica può permettere modifiche del trattamento in tempi possibilmente utili; Un momento critico dell’intervento terapeutico, durante il quale possono prender forma alcune significative premesse che condizioneranno l’esito del trattamento stesso
Soppressione virologica (potenza) e durata nel tempo 107 106 105 104 103 102 HAART HIV RNA BDL NEG weeks 1 2 3 4 16 48 96 144
Correlation between reduction in plasma HIV-1 RNA concentration 1 week after start of antiretroviral treatment and longer-term efficacy MA Polis, IA Sidorov, C Yoder, S Jankelevic, J Metcalf, BU Mueller, MA Dimitrov, P Pizzo, R Yarchoan, DS Dimitrov Lancet 2001; 358: 1760-65 124 HIV-1-infected patients being treated for the 1st time with a protease inhibitor HIV-1 RNA undetectable or declined by 1.5 log at 12 weeks = RESPONDERS The possibility of assessing drug efficacy from measurements of plasma HIV-1 concentrations made during the 1st week on therapy
k HIV RNA Correlation between reduction in plasma HIV-1 RNA concentration 1 week after start of antiretroviral treatment and longer-term efficacy MA Polis, IA Sidorov, C Yoder, S Jankelevic, J Metcalf, BU Mueller, MA Dimitrov, P Pizzo, R Yarchoan, DS Dimitrov Lancet 2001; 358: 1760-65 The kinetics of plasma HIV-1 RNA during the 1st week was analysed by a simple exponential model: Log(V) = c - Kt V = HIV RNA K = virus decay rate (in log) C = constant close to the baseline virus concentration V0
95 % POOR 95% GOOD n. of Patients Poor Responders 25 Good Responders 20 < 0.96 HIV RNA drop in 6 days 15 > 1.68 HIV RNA drop in 6 days 10 5 k 0 -0.20 -0.14 -0.08 -0.02 0.04 0.10 0.16 0.22 0.28 0.34 0.40 0.46
Correlation between reduction in plasma HIV-1 RNA concentration 1 week after start of antiretroviral treatment and longer-term efficacy MA Polis, IA Sidorov, C Yoder, S Jankelevic, J Metcalf, BU Mueller, MA Dimitrov, P Pizzo, R Yarchoan, DS Dimitrov Lancet 2001; 358: 1760-65 INTERPRETATION These results suggest that changes in HIV-1 concentration at day 6 after treatment initiation are major correlates of longer-term virological responses. They offer a very early measure of individual long-term responses suggesting that treatment could be optimized after only few days of therapy
Primary interferon resistance and treatment response in chronic hepatitis C infection: a pilot study W Jessner, M Gschwantler, P Steinl-Munda, H hofer, T Watkins-Riedel, F Wrba, C Mueller, A Gangl, P Ferenci Lancet 2001; 358: 1241-42 29 consecutive IFN-naive pts. with chronic HCV hepatitis HCV RNA measured within 24 h after one dose of 5-10 MU IFN 2b and thereafter, under daily 5 MU IFN 2b HCV RNA time
FARMACODINAMICA ANTIVIRALE: “dissezione” interpretativa della curva di caduta della viremia
Relevant fluctuations in the first 3 days Major decline in the days 3-6 HIV RNA Why more than 90% of HIV RNA is cleared off in few days while the remaining proportion takes so long to disappear below the threshold of detection? Slower decline thereafter until HIV RNA is no longer detectable 0 3 6 9 days 4 8 weeks
TECHNICAL ISSUES: sensitivity & specificity of the assay are lower at low HIV RNA concentrations VIROLOGICAL ISSUES: The remaining virions are the least - intrinsically - susceptible to antiretroviral chemotherapy PHARMACOKINETIC ISSUES: The remaining virions are produced in PK sanctuaries, such as in districts where drug penetration is lower and/or slower
Proportion of viral “quasispecies” according to drug sensitivity 90% HIV RNA [c] Drug [c] corresponding to the MEC (minimal effective concentration) a) The most sensitive virions are the first to be inhibited but are too few to account for a major decline; b) The most prevalent population is fully sensitive to the regimen and its inhibition accounts for the major decline seen in the days 3-6; 0 3 6 9 days 4 8 weeks c) The remaining virions are the least drug-sensitive and require a longer time to disappear
Proportion of viral “quasispecies” according to drug sensitivity 90% MEC [c] Drug [c] corresponding to the MEC (minimal effective concentration) MPC a) This small minority of less-sensitive virus might benefit of a selective advantage which begins when therapy is introduced b) Reduction of such advantage and restriction of this less-sensitive subpopulation might be achieved by adopting - at least initially - a stronger antiretroviral regimen
Slope 33% steeper day 1 2 3 4 5 6 7 k HIV RNA Moltò J, Ruiz L, Valle M, et al. Increased antiretroviral potency by the addition of T20 to a four drug regimen in ARV-naive HIV-infected patients. 45th ICAAC, Washington, DC, USA, December 16-19, 2005 LPV/r + EFV + 3TC + TDF (7 pts.) mean HIV RNA 5.10 log10/mL, mean CD4+ 362/L vs naive LPV/r + EFV + 3TC + TDF + T20(8 pts.) mean HIV RNA 4.98 log10/mL, mean CD4+ 463/L The addition of T20 to a highly active four drugs regimen increased antiviral potency by 33%. The long-term significance of this remains to be established.