Download
1 / 51
510 likes | 672 Vues
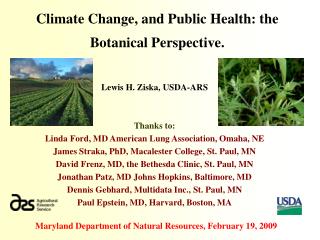
Climate Change, and Public Health: the Botanical Perspective. Lewis H. Ziska, USDA-ARS Thanks to: Linda Ford, MD American Lung Association, Omaha, NE James Straka, PhD, Macalester College, St. Paul, MN David Frenz, MD, the Bethesda Clinic, St. Paul, MN

E N D
Climate Change, and Public Health: the Botanical Perspective. Lewis H. Ziska, USDA-ARS Thanks to: Linda Ford, MD American Lung Association, Omaha, NE James Straka, PhD, Macalester College, St. Paul, MN David Frenz, MD, the Bethesda Clinic, St. Paul, MN Jonathan Patz, MD Johns Hopkins, Baltimore, MD Dennis Gebhard, Multidata Inc., St. Paul, MN Paul Epstein, MD, Harvard, Boston, MA Maryland Department of Natural Resources, February 19, 2009
Atmospheric CO2 So what if CO2 goes up?
I. An indirect effect of rising carbon dioxide: warmer temperatures. No H2O and CO2? Surface temperature would be –18oC. With H2O and CO2? Surface temperature is 15oC.
H2O vs. CO2 Poles Winter latitude Deserts Equator If water vapor is high, it will be the dominant warming gas….little effect of CO2 If water vapor is low, adding CO2 will increase the surface temperature.
Greenland is melting Greenland ice loss rate doubled in last 10 yrs
CO2, warming and public health. • Changes in range of insect or rodent borne diseases. • Changes in water or seafood borne diseases. • Increasing ground-level ozone, and respiratory ailments. • Contamination of drinking water due to excessive flooding. • Heat-related deaths / fewer cold related.
So what if CO2 goes up?, Part II, direct impacts Carbon dioxide is the source of carbon for photosynthesis, and consequently for 99% of all life. CO2 Food, Glorious Food! Nutrients, H2O CO2 + H2O + light O2 + organic C + chemical energy
Plants are Important. Plants are necessary for the flow of energy and carbon through ecosystems. 90% of all living matter consists of plant life. With the exception of a few subterranean organisms, if plants did not exist, life would not exist. Plant growth however is dependent on four physical inputs. Any perturbation in these inputs will alter all living systems. “People who imagined that life on earth consisted of animals moving against a green background, seriously misunderstood what they were seeing. That green background was busily alive. Plants grew, moved, twisted and turned, fighting for [resources]; and they interacted continuously with animals—discouraging some with bark and thorns, poisoning others, and feeding still others with pollen and seeds. It was a complex, dynamic process…one which most people didn’t understand. “ Michael Crichton, Page 86, “Jurassic Park”
But isn’t more plant growth desirable? “We are living in an increasingly lush environment of plants and animals as a result of the carbon dioxide increase. This is a wonderful and unexpected gift from the industrial revolution.” WSJ
CO2 is a VERY smart molecule. Green is not always good.
All life will be affected not only by temperature, but by the increase in carbon dioxide of and by itself.What are the implications for Weed Biology? Specifically: • Crops and weeds • Invasive weeds • Public Health.
How can plants affect public health?Some direct effects: • Allergies / Asthma: • Contact dermatitis: • Poison/Toxicology:
1. CO2, plants and allergies Principle Fall Allergen ~35 million sufferers Common ragweed.
Determining Ragweed Pollen Production Sampling pollen from ragweed catkins.
Response of common ragweed to CO2 g plant-1 • Pollen Production • 280 ppm 4.8 g • 370 ppm 10.9 g* • 600 ppm 20.5 g* • Antigen Amb a1 ELISA / mg protein • 280 ppm 4490 • 370 ppm 5290 • 600 ppm 8180* Chamber Study, USDA Functional Plant Biology 27:893-898 Functional Plant Biology 32:667-670 280 370 600
Ragweed in real life All this is “blue-sky” hypothetical &*^$%# anyway. It won’t happen in real-life, and even if it does, temperature and carbon dioxide effects are a long ways away. 10,000 feet on a mountaintop in Hawaii. Mauna Loa, “Official” CO2 data.
Is the rise in CO2 the same everywhere? • Change in average day-time CO2 concentration (ppm) from downtown Baltimore to an organic (rural) farm. 455.5 402.2 386.2
Is the increase in temperature the same? 20.7 19.1 18.6 • Change in average daily temperature (oC) from downtown Baltimore to an organic (rural) farm (2002).
Urbanization and climate change. Are these differences consistent? CO2 differences August, 2004 What about other meteorological variables? 8-h daytime ozone. 2004 season Overall: Urban-induced increases in carbon dioxide, air temperature and growing season are consistent with most IPCC near-term scenarios. With the exception of N deposition, other variables did not differ consistency, but N low relative to soil N.
And if it isn’t…Can we study the effects of climate change NOW? Placing four 2x2 m2 plots Near downtown Baltimore. Use same soil and seed bank in suburban and rural locations.
Got ragweed? 2006 Urban locale had longer growing season (milder winter), warmer temperatures, and more carbon dioxide.
Allergenic pollen producers, Western Weeds: Season: April through November Ragweed (A. atemissiifolia) Pigweed (Amaranthus retroflexus) Giant Sagebrush (Artemisia tridentata) English plantain (Plantago lanceolata) Russian thistle (Salsola kali) Fireweed (Kochia scoparia) Marsh elder (Iva species) Cocklebur (Xanthium strumarium, X. spinosa) Yellow Dock (Rumex crispus) Lambsquarter (Chenopodia album) Allergenic pollen producers, Mid-Western Weeds: Season: May through October Ragweed (A. atemissiifolia) Pigweed (Amaranthus retroflexus) Giant Ragweed (A. trifida) English plantain (Plantago lanceolata) Russian thistle (Salsola kali) Fireweed (Kochia scoparia) Marsh elder (Iva species) Cocklebur (Xanthium strumarium, X. spinosa) Lambsquarter (Chenopodia album) Allergenic pollen producers, Southern Weeds: Season: April through November Ragweed (A. atemissiifolia) Pigweed (Amaranthus retroflexus) Giant Sagebrush (Artemisia tridentata) English plantain (Plantago lanceolata) Marsh elder (Iva species) Cocklebur (Xanthium strumarium, X. spinosa) Yellow Dock (Rumex crispus) Lambsquarter (Chenopodia album) Allergenic pollen producers, Northeast Weeds: Season: May through September Ragweed (A. atemissiifolia) English plantain (Plantago lanceolata) Giant Ragweed (A trifida) Russian thistle (Salsola kali) Marsh elder (Iva species) Cocklebur (Xanthium strumarium, X. spinosa) Pigweed (A. retroflexus) Lambsquarter (Chenopodia album) Mugwort (Artemisia vulgaris)
Fungal decomposition of plants. Alternaria alternata has been associated with a number of respiratory problems such as rhinitis, asthma, allergic dermatitis and allergic sinusitis. The spores are the cause of the allergic reactions. For timothy grass grown from 300-600 ppm CO2, rising carbon dioxide levels results in reduced leaf N levels. Initial data suggest that increased C:N ratios could increase the rate of sporulation.
2. CO2, plants and contact dermatitis Can rising CO2 alter plant based dermatitis?
Poison ivy allergenicity Ambient Elevated Duke University, USDA study, PNAS 103:9086-9089
3. CO2, plants and poison Castor bean (Ricinus communis), produces ricin, one of the deadliest poisons known to man. Increasing CO2 by 300 ppm results in a 34% increase in photosynthesis (Grimer and Komor 1999). Vanaja et al. (2008) reports large response to rising CO2.
How can plants affect public health? Some indirect effects: • Food and Nutrition. • Medicines / Narcotics. • Disease vector biology. • Pesticide use.
CO2 and human nutrition. % Flour protein from wheat lines released during the 20th century. Recent cooperative work with NIH indicates an increase in omega-3-fatty acids in mung bean with rising CO2.
Temperature / Flowering Rice and temperature
Agriculture and water • Today, approximately 230,000 people were added to the population. Three cereals, rice, wheat and corn feed 50% of that population. These cereals in turn are heavily dependent on irrigation. • ~80% of freshwater is used in irrigation. • How will we maintain food supply with less water? Rice production
The “Big Three” at present. Rice 1980s: 3.1% per year 1990s: 1.4% per year 2000s: 0.8% per year Wheat 1980s: 2.9% per year 1990s: 0.9% per year 2000s: 0.4% per year
Only maize has kept pace with population. Maize 1980s: 2.2% per year 1990s: 2.5% per year 2000s: 3.5% per year Energy Independence? Maize is a heavy user of nitrogen fertilizer. This comes from natural gas (Haber process, N2NH4NO3). Russia: 47,570 billion ft3 Iran: 26,370 billion ft3 U.S.A.: 5,600
2a. CO2, plants and medicine Approximately 15% of all current pharmaceuticals in developed countries are derived solely from plants (85% in undeveloped countries).
Cocaine Atropine Caffeine Alkaloids derived from plants Nicotine Codeine Morphine Scopolamine Thebaine
2b. CO2, plants and narcotics. Effects unknown Growth increases. Anecdotal evidence
Papaver setigerum DC. (Wild poppy) Quantify growth and alkaloid production to carbon dioxide 300 ppm ~1950 400 ppm Current 500 ppm ~2050 600 ppm ~2090
P. setigerum is sensitive to even small (100 ppm) increases in carbon dioxide. Greatest relative stimulation has occurred with recent (last few decades) CO2 increase.
Averages P-value Variable 300 400 500 600 CO2 Effect ____________________________________________________________ Capsule No. 14.6 29.4 32.9 52.1 *** Capsule Wt. (g) 1.44 2.47 3.55 4.30 *** Latex (mg) 97 198 259 363 *** Morphine (%) 2.20 2.34 2.56 2.67 0.06 Concentration of other alkaloids did not increase with increasing CO2.
3-4 x increase in alkaloid production in wild poppy with recent and projected CO2 increases. Accepted in Climatic Change
Nicotine production • Nicotine Concentration • 294 ppm 4.7 µg g-1 • 378 ppm 4.4 µg g-1 • 690 ppm 3.6 µg g-1
3. CO2, plants and disease vectorsplants are not vectors per se, but: Hanta virus Nectar & pollen CO2 / temperature
4. CO2, plants and pesticide usage. Why can’t we just control these weeds? Ambient CO2 Future CO2 As carbon dioxide increases, glyphosate efficacy is reduced
Canada thistle: Best of the worst. 3 years of field trials at +250 ppm above ambient.
A synopsis of CO2 impacts on herbicide efficacy Efficacy is reduced in a number of studies. The basis for the reduction is not entirely known. However, if more pesticides are needed to kill weeds, then more trace chemicals are likely in the environment.
Climate change, plants and public health Direct Effects Allergies Contact dermatitis Toxicology Indirect Effects Nutrition Medicine Spread of disease vectors Increased pesticide use.