Download
1 / 28
280 likes | 395 Vues
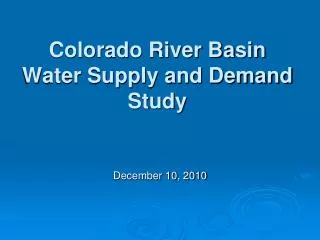
Climate, Growth and Drought Threat to Colorado River Water Supply. Balaji Rajagopalan, Kenneth Nowak University of Colorado, Boulder, CO James Prairie USBR Ben Harding Amec, Boulder Marty Hoerling, Joselph Barsugli, Bradley Udall and Andrea Reay ESRL/NOAA NIDIS Workshop, October 1-2 2008

E N D
Climate, Growth and Drought Threat to Colorado River Water Supply Balaji Rajagopalan, Kenneth Nowak University of Colorado, Boulder, CO James Prairie USBR Ben Harding Amec, Boulder Marty Hoerling, Joselph Barsugli, Bradley Udall and Andrea Reay ESRL/NOAA NIDIS Workshop, October 1-2 2008 Boulder, CO
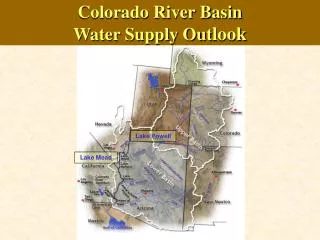
UC CRSS stream gauges LC CRSS stream gauges Lees Ferry
Below normal flows into Lake Powell 2000-2004 62%, 59%, 25%, 51%, 51%, respectively 2002 at 25% lowest inflow recorded since completion of Glen Canyon Dam Some relief in 2005 105% of normal inflows Not in 2006 ! 73% of normal inflows 2007 at 68% of Normal inflows 2008 at 111% of Normal inflows Recent conditions in the Colorado River Basin Colorado River at Lees Ferry, AZ 5-year running average
Colorado Water System Demand – Supply (stressed in recent decades)
Past Flow Summary • Paleo reconstructions indicate • 20th century one of the most wettest • Long dry spells are not uncommon • 20-25% changes in the mean flow • Significant interannual/interdecadal variability • Rich variety of wet/dry spell sequences • All the reconstructions agree greatly on the ‘state’ (wet or dry) information • How will the future differ? • More important, What is the water supply risk under changing climate?
IPCC 2007 AR4 Projections Wet get wetter and dry get drier… Southwest Likely to get drier
IPCC 2007 Southwest North America Regional Findings Annual mean warming likely to exceed global mean Western NA warming between 2C and 7C at 2100 In Southwest greatest warming in summer Precipitation likely to decrease in southwest Snow season length and depth very likely to decrease Less agreement on the upper basin climate – important for water generation in the basin Stuff and m
Models Precip and Temp Biases Models show consistent errors (biases) Western North America is too cold and too wet Weather models show biases, too Can be corrected
Almost all the water is generated from a small region of the basin at very • high altitude • GCM projections for the high altitude regions are uncertain
National Geographic, Feb 2008 Science, February 1, 2008
Colorado River Climate Change Studies over the Years Early Studies – Scenarios, About 1980 Stockton and Boggess, 1979 Revelle and Waggoner, 1983* Mid Studies, First Global Climate Model Use, 1990s Nash and Gleick, 1991, 1993 McCabe and Wolock, 1999 (NAST) IPCC, 2001 More Recent Studies, Since 2004 Milly et al.,2005, “Global Patterns of trends in runoff” Christensen and Lettenmaier, 2004, 2006 Hoerling and Eischeid, 2006, “Past Peak Water?” Seager et al, 2007, “Imminent Transition to more arid climate state..” IPCC, 2007 (Regional Assessments) Barnett and Pierce, 2008, “When will Lake Mead Go Dry?” National Research Council Colorado River Report, 2007 Stuff and m
Climate Projections from 11 GCMS for Upper Colorado Christensen and Lettenmaier (2007) Recent Studies (Seager et al., 2007; Milly et al., 2007 etc. suggest a reduction of 10 ~ 25% in the average annual flow)
Future Flow Summary • Future projections of Climate/Hydrology in the basin based on current knowledge suggest • Increase in temperature with less uncertainty • Decrease in streamflow with large uncertainty • Uncertain about the summer rainfall (which forms a reasonable amount of flow) • Unreliable on the sequence of wet/dry (which is key for system risk/reliability) • The best information that can be used is the projected mean flow
Water Supply System Risk Estimation Streamflow Scenarios Conditioned on climate change projections Water Supply Model Management + Demand growth alternatives System Risk Estimates For each year
Recent Dry Spell not unusual, based on Paleo reconstructions • Colorado River System has enormous storage of approx 60MAF ~ 4 times the average annual flow - consequently, • wet and dry sequences are crucial for system risk/reliability assessment • Streamflow generation tool that can generate flow scenarios in the basin that are realistic in • wet and dry spell sequences • Magnitude • Paleo reconstructions are • Good at providing ‘state’ (wet or dry) information • Poor with the magnitude information • Observations are reliable with the state and magnitude • Climate change projections have • Uncertain sequence and magnitude information • Reasonable projections of the mean flow • Need for combining all the available information • Observed Annual average flow (15MAF) is used to define wet/dry state. Need for Combination(Paleo, Observational and Climate Change projection)
Need for Combination(Paleo, Observational and Climate Change projection) • Paleo reconstructions are • Good at providing ‘state’ (wet or dry) information • Poor with the magnitude information • Observations are reliable with the state and magnitude • Climate change projections have • Uncertain sequence and magnitude information • Reasonable projections of the mean flow • Observed Annual average flow (15MAF) is used to define wet/dry state.
Generate system state Generate flow conditionally (K-NN resampling of historical flow) Streamflow GenerationModification to Prairie et al. (2008, WRR) Nonhomogeneous Markov Chain Model on the observed & Paleo data Intervening flow of the Resampled year is Added to this Lees Ferry Flow 10000 Simulations Each 50-year long 2008-2057 Superimpose Climate Change trend (10% and 20%)
Storage in any year is computed as: • Storage = Previous Storage + Inflow - ET- Demand • Upper and Lower Colorado Basin demand = 13.5 MAF/yr • Lakes Powell and Mead are modeled as one 50 MAF reservoir (active storage) • Initial storage of 25 MAF (i.e., current reservoir content) • Inflow values are natural flows at Lee’s Ferry, AZ + Intervening flows between Powell and Mead and below Mead • ET computed using Lake Area – Lake volume relationship and an average ET coefficient of 0.436 Water Balance Model(Modification of Barnett and Pierce, 2008)
Combined Area-volume RelationshipET Calculation ET coefficients/month (Max and Min) 0.5 and 0.16 at Powell 0.85 and 0.33 at Mead Average ET coefficient : 0.436 ET = Area * Average coefficient * 12
Management and Demand Growth Combinations The interim EIS operational policies employed with demand growing based on the upper basin depletion schedule. 1. with the demand fixed at the 2008 level. 1. with larger delivery shortages post 2026 (EIS Plus). 3. with a 50% reduced upper basin depletion schedule. 4. with full initial storage. 4. with post 2026 policy that establishes new shortage action thresholds and volumes. 6. with demand fixed at the 2008 level. All the reservoir operation policies take effect from 2026
Climate Change – 20% reduction Climate Change – 10% reduction
Probability of atleast one drying – Barnett and Pierce (2008)
Summary • Interim Guidelines (EIS) are pretty robust • Until 20206 these guidelines are as good as any in reducing risk • Water supply risk (i.e., risk of drying) is small (< 5%) in the near term ~2026, for any climate variability (good news) • Risk increases dramatically by about 7 times in the three decades thereafter (bad news) • Risk increase is highly nonlinear • \ • There is flexibility in the system that can be exploited to mitigate risk. • Considered alternatives provide ideas • Smart operating policies and demand growth strategies need to be instilled • Demand profiles are not rigid • Delayed action can be too little too late • Risk of various subsystems need to be assessed via the basin wide decision model (CRSS)