U.S. Semiconductor
U.S. Semiconductor. INTEL, AMD, AMAT. Jonathan Chao, Jesse Galpin, Kevin Sandhu, June Jiang. Semiconductor Industry. Industry Background Industry Profile Industry Trend Current Environment Key Industry Ratios and Statistics. Industry Background .

U.S. Semiconductor
E N D
Presentation Transcript
U.S. Semiconductor INTEL, AMD, AMAT Jonathan Chao, Jesse Galpin, Kevin Sandhu, June Jiang
Semiconductor Industry • Industry Background • Industry Profile • Industry Trend • Current Environment • Key Industry Ratios and Statistics
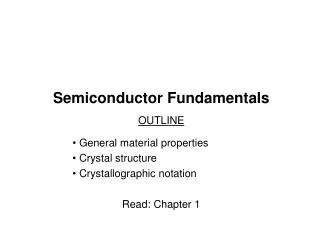
Industry Background • From the early 1900s to the 1950s : vacuum tubes • Invention of the transistor in 1948 • In 1958, integrated circuit (IC) • In 1971, Intel Corp.; Intel 4004 microprocessor, which ran at 108 kilohertz and served as a component in a calculator
Industry Background • Ongoing technological advancement • Rising performance, falling prices • Moore’s Law describes pace of innovation • Inherent cyclicality • Huge capital investments • Marketing chips: going for the design win • Targeting the end user
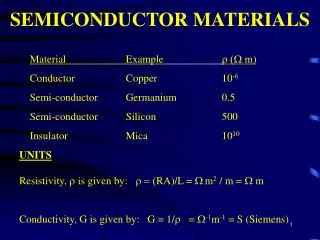
Types of Chips • Bipolar technology versus metal oxide technology • Discrete semiconductors • Analog semiconductors • Digital semiconductors • Microprocessors • Memory chips • Logic devices • Microperipherals • Microcontrollers • Standard cell logic • Optoelectronics. • Digital signal processors (DSPs)
How Chips Are Made • Semiconductors are produced through a highly advanced and complex manufacturing process. • The two basic stages in chip production are the “front end” and the “back end.” • The front end involves materials preparation (circuit design, photomask making, and manufacture of raw wafers) and wafer processing (repeated cycles of deposition, etch, doping, planarization, and in-process testing). • The back end consists of packaging and final test operations. • http://www.intel.com/education/makingchips/index.htm
Industry Profile Source: IC Insights.
Industry Trend • Semiconductors drive economic productivity • Lower trend line growth (next slide) • Evolving corporate strategies • High-end microprocessors drive the market • DRAM market especially prone to boom-and-bust cycles • Automotive chips receive renewed focus • Outsourcing continues to grow
Current Environment • Consumer products drive chip demand
Current Environment • FASB accounting rule change to phase in
Key Industry Ratios and Statistics • Global Sales Report.
Key Industry Ratios and Statistics • Semiconductor equipment book-to-bill ratio
Key Industry Ratios and Statistics • Wafer fabrication plant utilization rates
Key Industry Ratios and Statistics • Institute for Supply Management (ISM) Report on Business Source: http://www.ism.ws/ISMReport/PMIndex.cfm
Key Industry Ratios and Statistics • US index of leading economic indicators • Gross domestic product (GDP) • U.S. Consumer Price Index, CPI • U.S. Civilian Unemployment Rate • 3 Month U.S. Treasury Securities Yield
INTEL NASDAQ: INTC
Background Agenda • History • Current Events • Company Overview • Management • Business Structure • Operations • Products • Customers • Competitors • Financial Analysis
History (1 of 3) • 1965 • Moore’s Law: “the number of transistors incorporated in a chip will approximately double every 24 months” • 1968 • Integrated Electronics (Intel) Corp. is founded by Gordon Moore and Robert Noyce. • 1971 • Intel goes public
History (3 of 3) • 2004 & 2005 • New technology – Not Processors • Centrino • Dual-Core processors • 64-bit architecture • Hyper threading:
Current Events • Intel will make new Apple CPU’s NOT Motorola • Intel court battles with AMD and MicroUnity • Intel and RIM collaborate on BlackBerry devices • Intel will team with Microsoft in support of new DVD format HD DVD by Toshiba not with Sony’s Blu-ray Disc • Agreement to Acquire Digital Broadcast Technology Assets, Expertise from Zarlink Semiconductor – expand digital home segment • Earnings (3rd Quarter) announced Oct. 18, 2005
Company Overview (1 of 4) • Mission • Do a great job for our customers, employees, and stockholders by being the preeminent building block supplier to the worldwide digital economy
Company Overview (2 of 4) • Values • Customer Orientation • Results orientation • Risk taking • Great Place to work • Quality • Discipline
Company Overview (3 of 4) • Objectives • Extend silicon leadership and manufacturing capability • Deliver architectural innovation for platforms • Pursue worldwide opportunities
Company Overview (4 of 4) • Strategy • Utilize core competencies to develop advanced products • Exercise control over value chain • Utilize “Intel inside” marketing campaign • Expand into faster growing complementary businesses • Invest in companies globally to further strategic objectives (Intel Capital program)
Management (1 of 2) Joined Intel as Technology Development manager in 1974 Elected to BoD in 1992 Served as COO 1993-1997 Intel’s fourth president 1997 CEO in 1998 Chairman of the Board May 18, 2005 Joined Intel in 1974. Elected to BoD in 2002 Served as president and COO 2002-2005 CEO on May 18, 2005
Management (2 of 2) Andy D. Bryant Executive Vice PresidentChief Financial and Enterprise Services Officer Joined Intel in 1981. CFO in 1998. Chief Financial and Enterprise Services Officer in 1999 Sean Maloney Executive Vice PresidentGeneral Manager, Mobility Group Joined Intel in 1982 1999 Senior VP 2001 Executive VP 2004 Co-manager of Mobility Group
Past Intel Architecture Business Intel Communications Group Present Mobility Group Digital Home Group Digital Enterprise Group Digital Health Group Channel Products Group Business Structure (1 of 2)
Business Structure (2 of 2) • Mobility Group: • XScale processors for handheld devices (PDA’s) & Pentium M (Centrino) for notebooks • Digital Home Group: • Develop processors for digital entertainment devices in the living room. • Digital Enterprise Group: • Develop processors for all corporate systems (PC’s to datasevers) • Digital Health Group: • New area of focus - Products such as motion-detecting sensors that could help senior citizens live more independently. • Channel Products Group: • develop specific products for local markets around the world.
Operations • Manufacturing • Leader in semiconductor manufacturing and technology • Competitive advantage through economies of scale, • 11 fabrication facilities • 6 assembly and test facilities worldwide • 2003: $3.7 billion on capital investments Switch from 200mm wafers to 300mm wafers cuts price 30%. • Research and Development • 2005: $ 5.2 billion on R&D. (3.78b so far this year) • 7,000 researchers and scientists in labs around the world.
Major Products • Microprocessors, chipsets, boards, flash memory, application processors used in handheld devices, cellular baseband chipsets. • Networking and communications products, optical components and network processing components, embedded control chips
Major Customers • Distributors • Original Equipment Manufacturers (OEM) of computer systems and peripherals • PC users (retail)
Major Competitors • AMD • ATI • Broadcom • IBM • Nvidia • Qualacom • Samsung • SIS • Spanshion • Sun Microsystems • TI • Transmeta • Via
Financial Overview Regression Line Shows Sales Increasing at $573m
Financial Overview Revenue (pink) v. EPS (blue)
Financial Overview INTC over the past 365 Days
Financial Overview INTC over the past 365 days 50day/200day moving averages - Suggesting a Sell
Financial Overview INTC over the past 365 daysvs Semiconductor Industry over the past 365 days
Financial Overview INTC over the past 365 daysvs AMD over the past 365 days
Financial Overview $49.9 billion spend on 2.5B shares constant buyback program ($2.5B each ¼)