Download
1 / 50
500 likes | 525 Vues
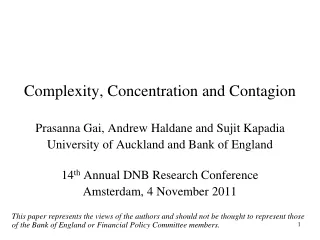
Complexity, Concentration and Contagion. Prasanna Gai, Andrew Haldane and Sujit Kapadia University of Auckland and Bank of England 14 th Annual DNB Research Conference Amsterdam, 4 November 2011

E N D
Complexity, Concentration and Contagion Prasanna Gai, Andrew Haldane and Sujit Kapadia University of Auckland and Bank of England 14th Annual DNB Research Conference Amsterdam, 4 November 2011 This paper represents the views of the authors and should not be thought to represent those of the Bank of England or Financial Policy Committee members.
A Complex Systems Approach • Stylised facts: complex and concentrated financial system • helpful to take a different approach; draw on other disciplines • important and wide-ranging policy implications • Apply a simple network model: • analyse how complexity and concentration contribute to fragility • draw useful policy insights (structural, but also cyclical) • Draw on techniques from epidemiology and ecology
Contributions of this Paper • Interbank network model allowing for ‘real-world’ structures • embeds role for unsecured interbank linkages, repo activity, liquidity hoarding and amplification from shocks to haircuts • interbank market may collapse with liquidity hoarding driving contagion • show that the system may exhibit ‘tipping points’ • Role of complexity and concentration in amplifying network risk • concentration: network structure • complexity: amount of intra-financial system activity; size of haircuts • Assess policy interventions to improve network resilience: • tougher microprudential liquidity regulation (both quantity and quality); • tougher requirements for systemically important institutions; • time-varying macroprudential policy (role of intra-financial system activity; liquidity requirements; minimum haircuts)
Outline of Talk • Stylised Facts • Methodological Approach • Model • Simulating Liquidity Crunches and the Role of Complexity and Concentration • Policy Lessons
The UK Interbank Network Network of large exposures(a) between UK banks(b)(c) (from June 2009 Bank of England Financial Stability Report) Source: FSA returns. (a) A large exposure is one that exceeds 10% of a lending bank’s eligible capital during a period. Eligible capital is defined as Tier 1 plus Tier 2 capital, minus regulatory deductions. (b) Each node represents a bank in the United Kingdom. The size of each node is scaled in proportion to the sum of (1) the total value of exposures to a bank, and (2) the total value of exposures of the bank to others in the network. The thickness of a line is proportionate to the value of a single bilateral exposure. (c) Based on 2008 Q1 data.
Intra-Financial System Activity: UK and US Repos and Financial CP as a proportion of M2 in the US Breakdown of UK Debt Source: Adrian and Shin, “The changing nature of financial intermediation and the financial crisis” Annual Review of Economics, 2:603–18. 2010. Source: Bank of England calculations and ONS Blue Book
Concentration of UK and US banking systems Top 3 banks by total assets as a percentage of total banking sector assets Source: FDIC and Bank calculations. Top 3 banks by total assets as a percentage of total banking sector assets. Data is to January 2009 7
The Interbank Market Collapse Three-month interbank rates relative to expected policy rates(a) Sources: Bloomberg and Bank calculations. (a) Spread of three-month Libor to three-month overnight index swap (OIS) rates. Five-day moving average.
The ‘Tipping Point’ Property of Networks (1) When will a rumour spread through a population? Suppose everyone spreads the rumour to 1 in 10 of their friends: If everyone has exactly 9 friends, the rumour will die out But if everyone has exactly 11 friends, it will go viral 10
The ‘Tipping Point’ Property of Networks (2) In reality, some people are better connected than others. People with more friends can spread the rumour more widely. But they are also more likely to hear it in the first place, since they have many friends to hear it from. So connectivity enters twice. A person with 10 friends is 10x10 = 100 times more effective at spreading a rumour than someone with 1 friend. Highly connected ‘super-spreaders’ are key to the propagation of contagion. 11
Why Complex Networks? • Tipping point example highlights usefulness of approach: • Contagion • Nonlinearities (big effects from small shocks) • Path Dependence • Seemingly Identical Shocks Different Outcomes • Heterogeneity • Dynamics • Arbitrary Network Structures • All key dimensions of systemic risk
Epidemiology and Finance • Financial systems have particular features: • Balance sheets • Links which are directed • Possibility for risk sharing • Local dependence
Network Structure • Network has n financial intermediaries (‘banks’) • Each bank is a node; unsecured interbank assets and liabilities define links (directed) • Average number of lending links = average number of borrowing links. Denote this average degree or connectivity, z. • Joint distribution of borrowing and lending links is arbitrary • key source of randomness
The Balance Sheet Assets Liabilities • Total unsecured interbank liability position of every bank is: • evenly distributed over each of its borrowing links • independent of the number of links the bank has • Collateral is needed for repo • Haircuts apply to collateral assets and collateral received as part of reverse repo • Aggregate haircut, h, and idiosyncratic haircut, hi AF LD AC LR ARR LIB AIB K AL
The Liquidity Condition Assets Liabilities • No systematic retail deposit inflows or outflows • Initially assume: • unsecured interbank deposits are rolled over • banks cannot recall unsecured loans or sell fixed assets • Then, if new unsecured borrowing is denoted by LN, a bank’s liquidity condition is given by: AF LD AC LR ARR LIB AIB K AL • Haircut shocks can trigger liquidity crises
What Can ‘Illiquid’ Banks Do? • ‘Pay up’ for wholesale funding • affects future profitability • stigma effects / adverse selection • Sell fixed assets in a fire sale: • likely to impose significant, real costs on the bank • stigma effects • Withdraw own lending to other banks (i.e. hoard): • may be a reputational cost • but seems more attractive than paying up significantly or a fire sale • and appears to have been the action chosen by banks during the crisis • [Credit crunch effects may be a longer-term concern but speak to possible welfare costs of interbank market collapse]
Introducing Liquidity Hoarding • Suppose that a fraction, m, of banks hoard liquidity from bank i due to their own liquidity stress • Assume that: • on average, hoarding banks withdraw a fraction l, of their deposits at bank i • when raising resources, banks withdraw funding equally and proportionately from all counterparties • Liquidity condition for a typical bank i becomes:
The Dynamics of Contagion (2) • Suppose that a single bank suffers a large idiosyncratic haircut shock and starts to hoard liquidity as a result. • If banks have k borrowing links, then, for linked banks, m = 1/ki. • So, for contagion to spread beyond the first bank, there needs to be at least one bank for which: • Liquidity hoarding can then propagate through network • network structure (joint distribution of borrowing and lending links) and parameters govern the potential for the spread of shocks.
Analytical Results in a Simpler Model (1) • Drop random network assumption • Suppose each bank is connected to exactly z other banks as both a lender and borrower (mean-field approximation). • Assume all banks have identical balance sheets (can drop all i subscripts) and no idiosyncratic shocks • Together assumptions imply AIB = LIB for all banks • Suppose also that banks can never raise unsecured interbank funding and that l = 1 (full withdrawal).
Analytical Results in a Simpler Model (2) • Then condition for contagion to spread becomes: • Identical for every bank in network: • shows ‘tipping point’ property • provides insight on the conditions when systemic liquidity crises may occur • Banks fail to internalise the impact of their hoarding behaviour on the broader network (role of l as a key amplifier) • Network externality insufficient self-insurance role for policy • Tipping point small policy change could have big impact
Methodology • Assume banks can never raise new deposits in the unsecured market • Assume full withdrawal (l = 1) • 250 banks • Liability side of each bank: 15% interbank liabilities; 4% capital • Asset side: interbank assets endogenous; 2% liquid assets • Repo: in the initial state, assume all collateral assets and collateral received via reverse repo is used for repo financing • reverse repo assets 11%; collateral assets 10%; aggregate haircut of 0.1 repo liabilities 20% • Count episodes in which at least 10% of banks hoard as systemic
Basic Liquidity Crunch (Poisson; Single Random Idiosyncratic Haircut Shock) • Accords with analytical expression
Adding an Aggregate Haircut Shock • Accords with analytical expression • May speak to evolution of crisis
Shock Targeted at Bank with Most Lending Links: Poisson [Similar results if target bank with highest amount of interbank assets]
Shock Targeted at Bank with Most Lending Links: Concentrated Network [Similar results if target bank with highest amount of interbank assets]
Cyclicality in Haircuts and Time-Varying Risk • Suppose that aggregate haircuts fall (eg in upswing of cycle) • Then banks can realise more repo funding against their collateral • Intra-financial system activity may expand more generally due to leverage spiral (Adrian and Shin, 2010; Geanakoplos, 2010)
Tougher Microprudential Liquidity Regulation • Liquid assets need to be high quality
Macroprudential Policy (1) • Model highlights two different dimensions of risk linked to intra-financial system activity: concentration and complexity • Complexity likely to be time-varying; concentration likely to be structural • Implications: • need two distinct policy instruments to help address network risk • time-varying macroprudential policy should depend on intra-financial system lending as well as lending to the real economy
Macroprudential Policy (2) • Capital and liquidity surcharges for SIFIs • aim to make key nodes more resilient • and incentivise banks to become less systemically important
Systemic Liquidity Requirements • Until now: uniform liquid assets across all banks • Suppose instead that each bank has a minimum 2% liquid assets, plus an amount equal to 10% of its interbank assets • Targeting liquidity is a dominant approach. And may also have a positive incentive effect
Macroprudential Policy (3) • Capital and liquidity surcharges for SIFIs • aim to make key nodes more resilient • and incentivise banks to become less systemically important • Time-varying policies to dampen the cycle • risk weights on intra-financial system exposures; • time-varying liquidity requirements; • adjusting haircuts on secured financing
Time-Varying Macroprudential Policy • Toughening regulation over the cycle can enhance resilience • Links to broader time-varying macroprudential policy
Broader Policy Implications • Network Transparency • Netting and Central Clearing • System Structure
Conclusion • Complexity and concentration may both contribute to contagion in financial networks • Both played a key role in the financial crisis • Important policy lessons • tougher microprudential liquidity requirements • macroprudential instruments • May help to achieve a more resilient financial system
The Cross-Border Banking Network: 1985Q1 Source: Bank for International Settlements, Locational by Residence data and IMF World Economic Outlook. Notes: Austria (AT), Australia (AU), Belgium (BE), Canada (CA),the Cayman Islands (KY), Switzerland (CH), Germany (DE), Greece (GR), Denmark (DK), Spain (ES), Finland (FI), France (FR), United Kingdom (UK), Ireland (IE), Italy (IT), Japan (JP), Luxembourg (LU), Netherlands (NL), Portugal (PT), Sweden (SE), and the United States (US). The thickness of the arrows are proportional to the dollar billion values of the outstanding claim of one resident banking group on another divided by world GDP in that year. The arrow points from creditor to borrower. All data below 0.1% of World GDP have been cut off.
The Cross-Border Banking Network: 1995Q1 Source: Bank for International Settlements, Locational by Residence data and IMF World Economic Outlook. Notes: Austria (AT), Australia (AU), Belgium (BE), Canada (CA),the Cayman Islands (KY), Switzerland (CH), Germany (DE), Greece (GR), Denmark (DK), Spain (ES), Finland (FI), France (FR), United Kingdom (UK), Ireland (IE), Italy (IT), Japan (JP), Luxembourg (LU), Netherlands (NL), Portugal (PT), Sweden (SE), and the United States (US). The thickness of the arrows are proportional to the dollar billion values of the outstanding claim of one resident banking group on another divided by world GDP in that year. The arrow points from creditor to borrower. All data below 0.1% of World GDP have been cut off.
The Cross-Border Banking Network: 2005Q1 Source: Bank for International Settlements, Locational by Residence data and IMF World Economic Outlook. Notes: Austria (AT), Australia (AU), Belgium (BE), Canada (CA),the Cayman Islands (KY), Switzerland (CH), Germany (DE), Greece (GR), Denmark (DK), Spain (ES), Finland (FI), France (FR), United Kingdom (UK), Ireland (IE), Italy (IT), Japan (JP), Luxembourg (LU), Netherlands (NL), Portugal (PT), Sweden (SE), and the United States (US). The thickness of the arrows are proportional to the dollar billion values of the outstanding claim of one resident banking group on another divided by world GDP in that year. The arrow points from creditor to borrower. All data below 0.1% of World GDP have been cut off.
Decomposing the Spread Sterling Dollar
Liquid Asset Holdings in the UK Sterling liquid assets relative to total asset holdings of UK banking sector(a)(from October 2008 Bank of England Financial Stability Report) Source: Bank calculations. (a) 2008 data are as of end-August 2008. (b) Cash + Bank of England balances + money at call + eligible bills + UK gilts. (c) Proxied by: Bank of England balances + money at call + eligible bills. (d) Cash + Bank of England balances + eligible bills.
US Banks’ Holdings of Treasury Bonds Source: FDIC Statistics on Depository Institutions
Methodological Approach • Large, insightful, theoretical literature on networks in (micro)economics (Goyal, 2007; Jackson, 2008): • but focus tends to be on network formation, behaviour in network games, and efficiency (e.g. Leitner, 2005; Gale and Kariv, 2007) • and/or (implied) network structures are not sufficiently realistic (e.g. Allen and Gale, 2000; Freixas et al, 2000) • Stylised facts highlight the importance of focussing on complex network models • Epidemiological models (e.g. Anderson and May, 1991; Newman, 2002) and cascade models (Newman et al, 2001; Watts, 2002) explore processes taking place on networks. • No network structure is precluded. • Particularly well suited for understanding how shocks can be transmitted along the links in a network.