
Uploaded by
carver
2 SLIDES
254 VUES
20LIKES
XL Stat
DESCRIPTION
XL Stat. MDS : Create a proximities matrix Describing data Similarity/dissimilarity matrices Highlight the variables/ratings and brands
Download
1 / 2
Download Presentation

Télécharger la présentation
XL Stat
An Image/Link below is provided (as is) to download presentation
Download Policy: Content on the Website is provided to you AS IS for your information and personal use and may not be sold / licensed / shared on other websites without getting consent from its author.
Content is provided to you AS IS for your information and personal use only.
Download presentation by click this link.
While downloading, if for some reason you are not able to download a presentation, the publisher may have deleted the file from their server.
During download, if you can't get a presentation, the file might be deleted by the publisher.
E N D
Presentation Transcript
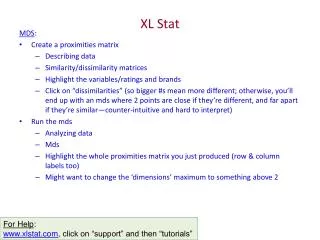
XL Stat MDS: Create a proximities matrix Describing data Similarity/dissimilarity matrices Highlight the variables/ratings and brands Click on “dissimilarities” (so bigger #s mean more different; otherwise, you’ll end up with an mds where 2 points are close if they’re different, and far apart if they’re similar—counter-intuitive and hard to interpret) Run the mds Analyzing data Mds Highlight the whole proximities matrix you just produced (row & column labels too) Might want to change the ‘dimensions’ maximum to something above 2 For Help: www.xlstat.com, click on “support” and then “tutorials”


More Related
Audio
Live Player