Download
1 / 53
530 likes | 717 Vues
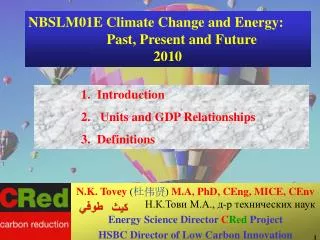
N.K. Tovey ( 杜伟贤 ) M.A, PhD, CEng, MICE, CEnv Н.К.Тови М.А., д-р технических наук Energy Science Director C Red Project HSBC Director of Low Carbon Innovation. NBSLM01E Climate Change and Energy: Past, Present and Future 2010. Introduction Units and GDP Relationships Definitions.

E N D
N.K. Tovey (杜伟贤) M.A, PhD, CEng, MICE, CEnv Н.К.Тови М.А., д-р технических наук Energy Science DirectorCRedProject HSBC Director of Low Carbon Innovation NBSLM01E Climate Change and Energy: Past, Present and Future 2010 • Introduction • Units and GDP Relationships • Definitions
Aim of Energy Section To review historic uses of Energy Provide basis for understanding Units and Definitions An overview of Global Energy Resources Barriers to Conservation Overview of Conservation Opportunities Brief Review of UK Energy Supply and Demand Issues of Electricity Supply and Fuel Mix An introduction to basic thermodynamics and opportunities arising from working with rather than against thermodynamics Energy Balance Tables NBSLM01EClimate Change and Energy: Past, Present and Future
Some Administrative Matters • All the Handouts and other information, including these PowerPoint Presentations may be accessed from the • Energy Home Page (on the INTERNET) • www2.env.uea.ac.uk/gmmc/env/energy.htm www2.env.uea.ac.uk/gmmc/env/energy.htm
1.1 INTRODUCTION • In UK each person is consuming energy at a rate of • 5kW • In USA it is 10 kW • 1/20th or World’s Population • consumes 25% of all energy • In Europe it is 5.7 kW • Globally it is around 2kW • ENERGY Consumption > Carbon Dioxide > Global Warming
Energy Consumption 2500 0 2000 1500 500 1000 Year 1.1 INTRODUCTION Nuclear Fusion ??
1.1 INTRODUCTION How much Carbon Dioxide is each person emitting as a result of the energy they use? In UK 9 tonnes per annum. What does 9 tonnes look like? Equivalent of 5 Hot Air Balloons! To combat Global Warming we must reduce CO2 by 60% i.e. to 2 Hot Air Balloons How far does one have to drive to emit the same amount of CO2 as heating an old persons room for 1 hour? 1.6 miles
Energy must be studied from a multi-disciplinary standpoint PHYSICAL SOCIAL TECHNICAL ENERGY POLITICAL ECONOMIC ENVIRONMENTAL Fuel Poverty Issues UEA Heat Pump
Peter Chapman’s book – Fuel’s Paradise written in 1970s some figures are out of date concepts still relevant providing an alternative view on energy where the unit of currency is linked to the unit of energy
In 1974 Bramber Parish Council decided to go without street lighting for three days as a saving. ( this was during a critical power period during a Miner’s Strike). Afterwards, the parish treasurer was pleased to announce that, as a result electricity to the value of £11.59 had been saved. He added, however, that there was a bill of £18.48 for switching the electricity off and another of £12.00 for switching it on again. It had cost the council £18.89 to spend three days in darkness. An example of where saving resources and money are not the same
What is wrong with this title? From the Independent 29th January 1996 similar warning have been issued in press for this winter
1.2 THE ENERGY CRISIS - The Non-Existent Crisis • No shortage of energy on the planet • Potential shortage of energy in the form to which we have become accustomed. Fossil fuels • FUEL CRISIS.
1.3 HISTORICAL USE OF ENERGY up to 1800 • ~ 15% of energy derived from food used to collect more food to sustain life. + energy used for making clothing, tools, shelter • Early forms of non-human power:- • 1) fire • 2) animal power • OTHER ENERGY FORMS HARNESSED • 1) Turnstile type windmills of Persians • 2) Various water wheels (7000+ in UK by 1085) • 3) Steam engines (?? 2nd century AD by Hero) • 4) Tidal Mills (e.g. Woodbridge, Suffolk 12th Century)
1.4 The First Fuel Crisis • LONDON - late 13th /early 14th Century • Shortage of timber for fires in London Area • Import of coal from Newcastle by sea for poor • Major environmental problems • -high sulphur content of coal • Crisis resolved - The Black Death.
1.5 The Second Fuel Crisis:- • UK - Late 15th/early 16th century • Shortage of timber - prior claim for use in ship-building • Use of coal became widespread -even eventually for rich • Chimneys appeared to combat problems of smoke • Environmental lobbies against use • Interruption of supplies - miner's strike • Major problems in metal industries led to many patents to • produce coke from coal (9 in 1633 alone)
1.6 Problems in Draining Coal Mines • Problems in Draining Coal Mines and Transport of coal • > threatened a third Fuel Crisis in Middle/late 18th Century • Overcome by Technology and the invention of the steam engine by Newcommen. • a means of providing substantial quantities of mechanical power which was not site specific (as was water power etc.). • NEWCOMMEN's Pumping Engine was only 0.25% efficient WATT improved the efficiency to 1.0%
1.6 Current Limitations Current STEAM turbines achieve 40% efficiency, • further improvements are • LIMITED PRIMARILY BY PHYSICAL LAWS • NOT BY OUR TECHNICAL INABILITY TO DESIGN AND • BUILD THE PERFECT MACHINE. • Coal fired power stations: • ultimate efficiency ~ 45% • even with IGCC • CCGT Stations are currently 47-51% efficient • > ultimately ~ 55%.
1.7 Energy Capabilities of Man • Explosive sports - e.g. weight lifting 500 W for fraction of second • Sustained output of fit athlete --> 100 - 200 W • Normal mechanical energy output << 50 W • Heat is generated by body to sustain body at pre-determined temperature:- Thermal Comfort • approx.: 50 W per sq. metre of body area when seated • 80 W per sq. metre of body area when standing.
Early Wind Power Devices • C 700 AD in Persia • used for grinding corn • pumping water • evidence suggests that • dry valleys were • “Dammed” to harvest • wind
1.8 Forms of Energy NUCLEAR CHEMICAL - fuels:- gas, coal, oil etc. MECHANICAL - potential and kinetic ELECTRICAL HEAT - high temperature for processes - low temperature for space heating • All forms of Energy may be measured in terms of Joules (J), • BUT SOME FORMS OF ENERGY ARE MORE EQUAL THAN OTHERS
1.9 ENERGY CONVERSION Energy does not usually come in the form needed: convert it into a more useful form. All conversion of energy involve some inefficiency:- Physical Constraints (Laws of Thermodynamics) can be very restrictive MASSIVE ENERGY WASTE. This is nothing to do with our technical incompetence. The losses here are frequently in excess of 40%
1.9 ENERGY CONVERSION Technical Limitations (e.g. friction, aero-dynamic drag in turbines etc.) can be improved, but losses here are usually less than 20%, and in many cases around 5%. Some forms of energy have low physical constraints converted into another form with high efficiency (>90%). e.g. mechanical <--------> electrical mechanical/electrical/chemical -----------> heat Other forms can only be converted at low efficiency e.g. heat ------------> mechanical power - the car! or in a power station
1.9 ENERGY CONVERSION USE MOST APPROPRIATE FORM OF ENERGY FOR NEED IN HAND. • e.g. AVOID using ELECTRICITY for • LOW TEMPERATURE SPACE heating • Hot Water Heating in UK, Germany, India, China but using electricity in Norway, Canada. Colombia, France is sensible • Cooking (unless it is in a MicroWave).
1.10 WHAT DO WE NEED ENERGY FOR? HEATING - space and hot water demand (80%+ of domestic use excluding transport) LIGHTING COOKING ENTERTAINMENT REFRIGERATION TRANSPORT INDUSTRY - process heating/ drying/ mechanical power • IT IS INAPPROPRIATE TO USE ELECTRICITY FOR SPACE HEATING
1.11 GRADES OF ENERGY HIGH GRADE: - Chemical, Electrical, Mechanical MEDIUM GRADE: - High Temperature Heat LOW GRADE: - Low Temperature Heat • All forms of Energy will eventually degenerate to Low Grade Heat • May be physically (and technically) of little practical use - i.e. we cannot REUSE energy which has been degraded - except via a Heat Pump.
1.12 ENERGY CONSERVATION • Energy Conservation is primarily concerned with MINIMISING the degradation of the GRADE of ENERGY. (i.e. use HIGH GRADE forms wisely - not for low temperature heating!!). • To a limited extent LOW GRADE THERMAL ENERGY may be increased moderately in GRADE to Higher Temperature Heat using a HEAT PUMP. • However, unlike the recycling of resources like glass, metals etc., where, in theory, no new resource is needed, we must expend some extra energy to enhance the GRADE of ENERGY.
N.K. Tovey (杜伟贤) M.A, PhD, CEng, MICE, CEnv Н.К.Тови М.А., д-р технических наук Energy Science DirectorCRedProject HSBC Director of Low Carbon Innovation NBSLM01E Climate Change and Energy: Past, Present and Future 2010 2. Units and GDP Relationships 26
2.0 UNITS of Energy: INTRODUCTION • How much Energy is there in different fuels?
2.0 UNITS of Energy: INTRODUCTION • How much CO2 is given of by different fuels ? • Figures in RED assume heating is provided by condensing appliances • A litre of diesel has 8.6% more energy than 1 litre of petrol • How far does one have to drive in a small family car to emit as much CO2 as heating and old persons room for 1 hour? • 1.6 miles 28
2.0 UNITS of Energy: INTRODUCTION The study of ENERGY is complicated by the presence of numerous sets of UNITS OF MEASURE which frequently confuse the issue. It is IMPORTANT to recognise theDIFFERENCE between the TWO BASIC UNITS:- a) the JOULE (a measure of quantity) b) the WATT (a RATE of acquiring/ converting/ or using ENERGY).
2.1 Quantity of Energy • The basic unit of Energy is the JOULE. • the WORK DONE when a force moves through a distance of 1 metre in the direction of the force. The SI unit is the JOULE, and all forms of Energy should be measured in terms of the JOULE. • FORCE is measured in Newtons (N) • DISTANCEis measured in metres (m) • Thus WORK DONE = Newtons x metres = Joules. • A 1 kg lump of coal, or a litre of oil will have an equivalent Energy Content measured in Joules (J). • Thus 1 kg of UK coal is equivalent to 24 x 106 J. • or 1 litre of oil is equivalent to 42 x 106 J. • The different units currently in use are shown in Table 2.1
2.1. QUANTITY OF ENERGY • JOULE (J). • calorie (cal) • erg • Kalorie (or kilogram calorie Kcal or Kal) • British Thermal Unit (BTU) • Therm • kilowatt-hour (kWh) • million tonnes of coal equivalent (mtce) • million tonnes of oil equivalent (mtoe) - (often also seen as - mtep - in International Literature). • litres of oil • gallons (both Imperial and US) of oil • barrels of oil • million tonnes of peat equivalent • Table 2.1 Energy units in common use.
2.1. QUANTITY OF ENERGY • Situation is confused further • US (short) ton • Imperial (long) ton • metric tonne. • European Coal has an Energy content 20% than the equivalent weight of UK coal. • See Data Book for conversion factors. • Always use the SI unit (JOULE) in all essays etc. If necessary cross refer to the original source unit in brackets. • CONSIDERABLE CONFUSION SURROUNDS THE USE OF THE KILOWATT-HOUR -- DO NOT USE IT!!!!
2.2. RATE OF USING ENERGY The RATE of doing WORK, using ENERGY is measured in WATTS. i.e. 1 Watt = 1 Joule per second 1 W = 1 J s-1 Burn 1 kg coal (Energy Content 24 x 106 J) in 1 hour (3600 seconds) – RATE of consumption is:- 24 x 106 / 3600 = 6666.7 W Equally, a Solar Panel receiving 115 W m-2 (the mean value for the UK), the total energy received in the year will be:- 115 x 24 x 60 x 60 x 365 = 3.62 x 10⁹ J.
2.2. RATE OF USING ENERGY NOTE: THE UNITS:- KILOWATTS per HOUR KILOWATTS per YEAR KILOWATTS per SECOND are MEANINGLESS (except in very special circumstances). WARNING: DO NOT SHOW YOUR IGNORANCE IN EXAM QUESTIONS BY USING SUCH UNITS
2.3. SI PREFIXES • milli - m x 10-3 • kilo - k x 103 • Mega - M x 106 • Giga - G x 109 • Tera - T x 1012 • Peta - P x 1015 • Exa - E x 1018 • NOTE:- • 1) The prefix for kilo is k NOT K • 2) There are no agreed prefixes for 1021 or 1024 • 3) Avoid mixing prefixes and powers of 10 wherever • possible. • i.e. 280 GJ is permissible but not 28000 GJ • or 2.8 x 10 4 GJ.
Energy – GDP Relationships 40000 USA 35000 Qatar Japan 30000 Canada UK 25000 France Other EU Countries GDP per head (US$ (95) 20000 Germany Mediterranean EU Poland Nordic EU 15000 New EU Russia 10000 China 5000 India 0 0 5 10 15 20 25 30 kW per Head The wealth of a country and energy requirements are related
Energy – GDP relationships As an exercise in unit conversion download the energy-GDP relationships file from the Web Page. Convert the units of thousand tonnes of oil equivalent into PetaJoules. Work out the energy requirement associated with £1 of GDP. Plot the relationship with time - How has this changed over the last 60 years? Noting the energy requirement for £1 wealth, estimate what the price of petrol and diesel should be if society valued energy at the same level as wealth generally if the energy content of a litre of petrol is 32.9 MJ/litre and that of diesel is 35.7 MJ/litre As an exercise in your own time – repeat the analysis for each of the fuels Coal, Gas, Oil, Electricity separately.
N.K. Tovey (杜伟贤) M.A, PhD, CEng, MICE, CEnv Н.К.Тови М.А., д-р технических наук Energy Science DirectorCRedProject HSBC Director of Low Carbon Innovation NBSLM01E Climate Change and Energy: Past, Present and Future 2010 3. Energy Definitions 39
3. ENERGY - DEFINITIONS • All uses of energy involve conversion of one form of energy to another. • Energy conversion processes is inherently inefficient the amount of useful energy out Efficiency () = ----------------------------------------- x 100% the amount of energy put in Some Typical Efficiencies:- UEA boiler ~87% Power Station Boiler 90-92% Open Coal fire 10% Coal Central Heating 40-50% Steam Turbine 45-50% • steam (railway) engines 10% • cars 20 - 25% • electric fire ~100% • gas central heating boiler 70 - 75% • oil central heating boiler 65 - 70%
ENERGY DEFINITIONS • 3.2 PRIMARY ENERGY - • The energy content of the energy resource when it is in the ground. • 3.3 DELIVERED ENERGY - • The energy content of the fuel as it is delivered to the place of use. • 3.4 USEFUL ENERGY - • The actual amount of energy required for a given function IN THE FORM USABLE FOR THAT FUNCTION.
3.5 PRIMARY ENERGY RATIO (PER) Primary Energy Content of fuel PER = ------------------------------------------ Delivered Energy content of fuel EXAMPLES:- Gas - 1.06 : Oil - 1.08 : Coal - 1.02 -------------------------------------- e.g. for gas, 6% of the energy extracted is used either directly, or indirectly to deliver the energy to the customer. - exploration - making production platforms - making pipelines - pumping - administration and retail of fuel - fractionating/blending fuel For Electricity, the PER has varied over the years - it is currently around 2.80
3.6 Appliance Efficiency () Appliances are not, in general 100% efficient in converting the fuel into a useful form of energy. Thus (from 3.1 above):- The efficiency of the appliance may be expressed as:- useful energy out (in form required) = ------------------------------------------------ energy input to appliance (+) + in most cases, the energy input will be the delivered energy, so:- useful energy = ------------------------------- delivered energy
3.7 FURTHER COMMENTS ABOUT EFFICIENCY • Life Cycle Analysis • If we want 1 GJ of useful energy, • How much energy must we dig from the ground if we require • the energy as heat from as gas boiler with an efficiency • of 70%? • Primary Energy Required • = 1 / 0.7 x 1.06 = 1.51 GJ • ======= • Be sure you understand this relationship, and why it is not:- • 0.7 x 1.06 • or 1.3 x 1.06
3.8 ENERGY EFFICIENCY • Energy Efficiency is the efficient use of energy. • IT DOES NOT NECESSARILY MEAN A SAVING OF • RESOURCES. • e.g. • Producing 20% more products for same energy input would not save energy overall even though it would reduce energy requirement per product. • Insulating a poorly heated house will increase the efficiency of using energy, but the savings in resources will be small • increased temperature • avoiding hypothermia is efficient use of energy.
3.9 ENERGY CONSERVATION Energy Conservation is the saving of energy resources. Energy Efficiency is a necessary pre-requisite for Energy Conservation (remember Energy Efficiency does not necessarily mean Energy Conservation). It is interesting to note the Government Office was termed THE ENERGY EFFICIENCY OFFICE Some members of the Government still believe Energy Efficiency and Energy Conservation are the same. However, the ENERGY SAVING TRUST (relevant for domestic applications is closer to what is needed. The CARBON TRUST is the equivalent organisation for businesses
3.10 OTHER DEFINITIONS OF ENERGY CONSERVATION • Industry/Commerce often consider Energy Conservation only as a saving in MONETARY terms • The moral definition is the saving of resources. This often will not result in a MONETARY saving • The so called Energy Conservation Grants to Industry in late 1970's early 1980's were not Conservation Grants at all, but Grants to encourage switching of fuels from oil to coal.
3.11 CALORIFIC VALUE • Energy Content of the fuel per unit mass or unit volume. • - maximum amount of energy that can be extracted from a unit of the fuel. • There are two Calorific Values:- • lower calorific value (LCV) • This is amount of energy derived by combusting a fuel when the products of combustion are emitted at temperatures in excess of 100oC i.e. any water present is emitted as steam. • upper calorific value (UCV) • This is amount of energy derived by combusting a fuel when the products of combustion are emitted at temperatures below 100oC i.e. any water present is emitted as water vapour. • The difference between the two calorific values is about 5% (UCV > LCV)
3.12 SPECIFIC HEAT This is the Energy required to raise the temperature of 1 kg of a body through 1 degree Celsius. This parameter is needed when storage of Energy is considered. (e.g. size of Hot Water Cylinder in a House)