BUILDING QUALITY LEARNING USING PERIODIC ASSESSMENTS
330 likes | 483 Vues
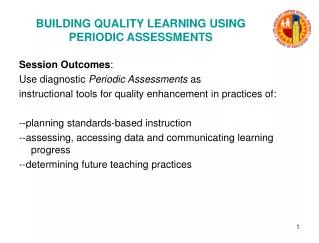
BUILDING QUALITY LEARNING USING PERIODIC ASSESSMENTS. Session Outcomes : Use diagnostic Periodic Assessments as instructional tools for quality enhancement in practices of: --planning standards-based instruction --assessing, accessing data and communicating learning progress

BUILDING QUALITY LEARNING USING PERIODIC ASSESSMENTS
E N D
Presentation Transcript
BUILDING QUALITY LEARNING USING PERIODIC ASSESSMENTS Session Outcomes: Use diagnostic Periodic Assessments as instructional tools for quality enhancement in practices of: --planning standards-based instruction --assessing, accessing data and communicating learning progress --determining future teaching practices
CRITERIA FOR EVALUATING PROFESSIONAL DEVELOPMENT SESSION OUTCOMES
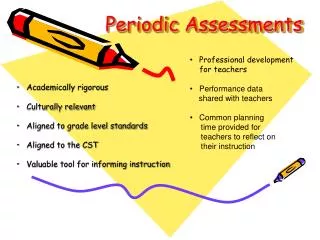
PERIODIC ASSESSMENT PROGRAM COMPONENTS * Program Overview * Continuous Improvement Phases * Customer Service * Process for Scanning, Scoring & Reporting
Schedule of Periodic Assessment and Follow-Up Sessions for Analysis and Use of Data • Office of Instruction establishes calendars annually • Alternative calendar, Continuation, Options schools and Special Education Centers may create special calendars • Calendars available online on “InsideLAUSD”
Planning Phase • Identify priority standard using the District’s Instructional Guides, State Curriculum Frameworks and “Standards Comparability Charts” to plan what students should know and be able to do and how learning can be expedited using research-based practices that are culturally relevant and responsive; • Schedule collaborative time for teachers to use the data from each Periodic Assessment for determining future instruction/intervention
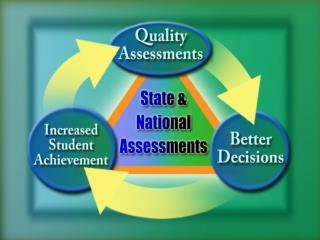
Correlations Between Students’ Performance on District Periodic Assessments (PAs) and the California Standards Tests (CSTs) Analyses by the District’s Program Evaluation and Research Branch showed strong correlations between student PA performance and CST performance.
Assessment OF Learning, California Standards Tests End of year or course Judgmental feedback Audits achievement Report on Program and final accountability Another example: the California High School Exit Exam (CAHSEE) Assessment FOR Learning, LAUSD Periodic Assessments Ongoing administration Descriptive feedback Measures progress Informs teacher practice and professional development Another example: Standards-aligned teacher-made assessments The District Uses Two Types of Assessment Measures:
What are the purposes and value of the Comparability Charts? (1) Provide a graphic display of the relationship between Periodic Assessments and the California Standards Tests (2) Confirm and validate the importance of learning going on in District classrooms (3) Delineate the instructional sequence as outlined in the District Instructional Guides
The Comparability Charts CST Blueprint for subject and grade Standards for each periodic assessment Shading according to standard sets Unshaded standards are not separately assessed on CST Number of questions by content strand Shading corresponds to CST Blueprint Number of questions by standard Number of questions by standard Non-assessed or embedded standards are omitted
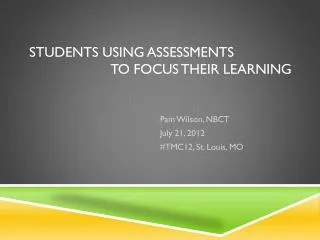
Sample Activity for Using Comparability Charts Step 1. In your small group (at your table), select one chart to examine and discuss. (Ideally it will be a chart that relates to your current instruction) Step 2. Solicit someone to take notes as the group identifies which standards are emphasized in the end-of-year CST? Step 3. Use the chart to determine how those standards are sequenced and measured on the Periodic Assessments Step 4. Choose a quarter using the Instructional Guide for the subject and chart how much time will be devoted to each of the concepts in which the standards are embedded. Step 5. Think about what students should be able to do as a result of time spent on each of the concepts / standards. (Refer to CST released items and sample Periodic Assessment items so that teachers can begin to think about how these concepts/standard might be assessed) Step 6. Participate in follow-up meetings with other grade levels/subject teachers and/or by grade level/department sessions at your school site that follow receipt of Periodic Assessment results to use the data to: • Plan future instruction based upon student strengths and needs. • Identify lessons that were particularly effective for developing understanding in students. Think about the instructional strategies that might have contributed to a particular lesson’s success.
Planning Phase c. Review and experience sample Periodic Assessments by having teachers take assessments collaboratively in order to map the concepts/skills students are expected to demonstrate; d. Plan use of text-support materials and resources.
Doing Phase • Present content to students, implementing effective instructional strategies and appropriate materials
Doing Phase b. Administer school/classroom measures of learning and the District’s Periodic Assessments to preserve equity and consistency of expectations as scheduled in the District’s calendars of common measures; c. Score student work on Periodic Assessment; multiple choice (centrally score electronically) and performance/constructed response/writing sample (teacher-scored) evaluate data reports and provide timely feedback to students.
Studying Phase • Use data to prescribe areas for improvement and to inform instruction; engage students in reflection, intervention, transition, and extension
Item Response Report (Sorted by Question) (Grade 4 Physical Science)
Research-Based Practices to Support Instruction Using Periodic Assessments as a Tools for Building Quality Learning c. Develop systematic means of harvesting effective practices for wider dissemination and replication and allocate resources accordingly. • Selected Research Reading • Marzano, R., (2003), “What Works in Schools: Translating Research Into Action”, ASCD • Symonds, K., (2003), “After the Test: How Schools Are Using Data to Close the Achievement Gap”, Bay Area School Reform Collaborative, San Francisco, CA
Professional Development Evaluation And Feedback
Professional Development Feedback Form Individual feedback will be used to make refinements and improvements to future professional development
Collaborative Professional Development Plus (+) / Delta (Δ) Feedback