Download
1 / 22
220 likes | 336 Vues
This presentation details a web-based tool developed to estimate greenhouse gas (GHG) benefits from transportation projects in Los Angeles County. It discusses the context of SB 375 legislation targeting GHG reductions, the technical approach for creating the tool, and its application in the Gateway Cities region. The tool allows users to analyze project-specific impacts on GHG emissions, supporting local transportation initiatives aimed at reducing vehicle miles traveled (VMT) and improving air quality.

E N D
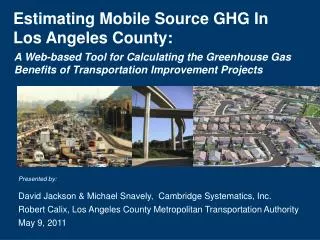
Estimating Mobile Source GHG In Los Angeles County: A Web-based Tool for Calculating the Greenhouse Gas Benefits of Transportation Improvement Projects Presented by: David Jackson & Michael Snavely, Cambridge Systematics, Inc. Robert Calix, Los Angeles County Metropolitan Transportation Authority May 9, 2011
LA Metro GHG Impact ToolsetAgenda • Background/Context • Technical Approach • Web-Based Analysis • Applying Tools in the Gateway Cities COG • Results
1. Background SB 375 Mobile-Source GHG Reduction Legislation • Sets GHG reduction targets for MPOs • Targets for 2020 and 2035 vs. 2005 • Metric : lbs CO2e per capita • MPOs must develop “Sustainable Communities Strategy” (SCS) that: • Lays out regional strategy for meeting targets • Is integrated w/long range planning process • Has “reasonably expected” funding
1. BackgroundSCAG Region SB 375 GHG Reduction Targets Lbs carbon/capita Per weekday 8% 13%
1. Background • Los Angeles County: Strained Infrastructure Los Angeles County
1. BackgroundLos Angeles County: Strained Infrastructure Estimated Growth 2005 - 2035
1. BackgroundOpportunity to Measure (and fund) GHG Reduction… • CS Moving Cooler sketch-planning methodologies • Adapt to reflect specific nature of travel within LA County. • Metro’s Existing Congestion Mitigation Fee program site • Project & growth database accessible to all cities • Fee on new development to fund improvements to network • If projects coincide, fee solves unfunded mandate problem
2. Technical ApproachProcess Overview • Adapt “best practices” project methodologies to region • Local research for elasticities, speed-flow curves, etc. to accurately portray traveler response in LA County • Project-specific inputs that city staff can fill-in • Develop and test a draft analytical spreadsheet tool • Develop and test tool in a web-based environment.
2. Technical Approach Applicable Projects w/ GHG Reduction Potential • Intersection Improvements • Corridor System Operations Improvements • Roadway Capacity Improvements • On/Off-Ramp Capacity • RR Grade Separations • Transit Enhancements • Park-and-Ride Lots • Bike/Pedestrian Projects • Transit/Managed Lanes (HOT, Shared Busway) Limited to improvements eligible for fee program Either Reduce VMT – or – Reduce Delay
2. Technical ApproachProcess Overview VMT Reduction Projects (bike/ped, transit, park/ride) Project-Specific Details (extent, frequency) Corridor-Specific Details (ADT, Ridership) Average Trip Lengths Apply Local Elasticity Change in Travel Time or Cost Project Effectiveness Vehicle Trip Reduction VMT Reduction Area-Specific Details (Density, Activity Centers) Other Local Factors (e.g, lot usage %) LDV CO2e Emission Factors CO2e Reduction
2. Technical ApproachProcess Overview Delay Reduction Projects – Corridor (Signal Sync, etc.) LDV CO2e Emission Factor by Speed “No Project” Inputs Corridor Details e.g. ADT + operations Corridor No-Project Peak VHT & Congested Speed No-Project CO2e Emissions Apply Appropriate Speed/Flow Curve CO2e Reduction Corridor Project Peak VHT & Congested Speed “Project” Inputs Corridor Details + Project-Specific (e.g. extent, # intersections) Project CO2e Emissions LDV CO2e Emission Factor by Speed
2. Technical ApproachProcess Overview Delay Reduction Projects – Intersection Projects Existing Condition LDV CO2e Emission Factors Intersection Peak Period Approach Volumes Intersection Existing Delay Calculations Change in Total Peak Delay CO2e Reduction Post -Improvement Delay Calculation Project-Specific Details
2. Technical ApproachSummary of Outputs – GHG Emission Calculations
3. Web-Based AnalysisLA Metro CMFWebtool Project Database Socioeconomic Forecast Data Fee Calculator GHG Analysis
3. Web-Based AnalysisLA Metro Project-Level GHG Sketch-Planning Tool
3. Web-Based AnalysisLA Metro Project-Level GHG Sketch-Planning Tool
3. Web-Based AnalysisLA Metro Project-Level GHG Sketch-Planning Tool User-specified Derived on back-end
3. Web-Based AnalysisLA Metro Project-Level GHG Sketch-Planning Tool
4. Applying Tools in the Gateway Cities COG Gateway Cities COG
4. Applying Tools in the Gateway Cities COGBackground • 27 Cities + Port of Long Beach • Already dense & built out • Low-income • Very congested roadway network • Transportation GHG reduction benefits Initial SCS Analysis using Metro toolset shows considerable per capita reduction from Transportation projects
6. Results • Project-level sketch planning tools serve policy need • Web-based interface allows easy data entry for all users • Transportation projects show potential for significant GHG reduction in communities at/near capacity • Integration with congestion mitigation fee offers SCS funding solution • Opportunities exist to improve and expand functionality
CONTACT David Jackson Cambridge Systematics, Inc. Bethesda, MD 301-347-0100 Michael Snavely Cambridge Systematics, Inc. Oakland, CA 510-873-8700 Robert Calix LA County Metropolitan Transportation Authority Los Angeles, CA 213-922-5644