Download
1 / 55
570 likes | 758 Vues
Protecting our Health from Professionals Climate Change: a Training Course for Public Health. Chapter 14: Global Change, Air Quality, and Human Health. Lecture Overview. Introduction to climate and air quality Characteristics and health effects of major anthropogenic air pollutants

E N D
Protecting our Health from Professionals Climate Change: a Training Course for Public Health Chapter 14: Global Change, Air Quality, and Human Health
Lecture Overview • Introduction to climate and air quality • Characteristics and health effects of major anthropogenic air pollutants • Exposure-response relationships • Global burden of disease due to air pollution • Has climate change affected air pollution? • Observed trends • Integrated modeling • Co-benefits assessment
Introduction • The mixtures of air pollutants produced by burning of fuels can: • Adversely affect human health • Promote climate change • In addition • Climate change can influence air pollution, resulting in direct health effects • Climate change can affect other aspects of air quality, including smoke from agricultural or wildfires, and aero-allergens like pollen and mold spores STRATUS CONSULTING
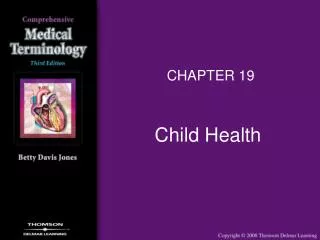
London: Mid-day in December 1952 UK Met Office, 2009
London Killer Fog, December, 1952 UK Met Office, 2009 Date
PM2.5 Levels in Dhaka, Bangladesh Standard Clean Air Initiative, 2006
Carbon monoxide (CO) Nitrogen dioxide (NO2) Lead (Pb) Sulfur dioxide (SO2) Ozone (O3) Particulate matter (PM2.5,PM10) Common Pollutants that are of Human Health Concern
Produced by incomplete combustion Inhibits the capacity of blood to carry oxygen to organs and tissues. People with chronic heart disease may experience chest pain when CO levels are high At very high levels, CO impairs vision, manual dexterity and learning ability, and can be fatal Carbon Monoxide
Is produced from high-temperature combustion Affects lung function in persons with asthma Contributes to acid rain and secondary particle formation Is a precursor of ground-level ozone Nitrogen Dioxide
Retards intellectual development of children Lead in gasoline was historically the principal source Lead
Emitted from combustion of sulfur-containing coal and oil, and from metal smelting operations Reversible declines in lung function of people with asthma, and exacerbates respiratory symptoms in sensitive individuals Also contributes to acid rain and to formation of PM2.5 through atmospheric reactions Emissions reduced using scrubbers Sulfur Dioxide
Main pollutant responsible for photochemical smog, formed via reactions in the atmosphere from primary pollutants (NOx and VOCs) in the presence of sunlight Higher temperatures favor ozone formation Strong oxidant that damages cells lining the respiratory system, resulting in a variety of adverse health outcomes, including lung function decrease, asthma attacks, and premature death Ozone is also a greenhouse gas Ozone
Ground-level Ozone Formation Queensland Government Environmental Protection Agency, 2006
Can be either primary or secondary; produced by combustion, atmospheric reactions, and mechanical processes Wide range of physical/chemical properties Wide range of human health impacts, including premature death Higher temperatures may favor secondary formation Some particle types contribute to climate warming; others to climate cooling Particulate Matter (PM2.5, PM10)
Fine Particle Composition Annual average fine particle data for 2001 from the Look Rock station of the Tennessee Valley Authority Tennessee Valley Authority, 2009
Historical experience provides strong evidence for causal relationship between air pollution and premature death Modern epidemiology studies have consistently found significant associations Two primary epidemiologic study designs: Time series studies of acute effects Cohort or cross-section studies of chronic effects Let’s look at the evidence for particle health effects… Health Effects of Air Pollution
Provides results relevant for policy makers Assesses effects of real mix of pollutants on human health Includes full range of susceptible populations Air Pollution Epidemiology
But… Pollutants tend to co-vary, making it hard to identify pollutant-specific effects Demonstrates association between outcome and exposure, but not cause and effect Confounding factors must be controlled Exposure assessment is “ecologic” Air Pollution Epidemiology (cont.)
Time Series Epidemiology • Addresses short-term, acute effects of air pollution • Involves analysis of a series of daily observations of air pollution and health data • Widely used and economical approach, often utilizing readily-available data
Time Series Epidemiology (cont.) • Temporal studies avoid many of the confounding factors that can affect spatial studies • However, time-varying factors may confound the pollution associations … • Seasonal cycles, weather variables, day of week
Ozone and Acute Deaths Bell et al., 2004
0.7 0.7 0.6 0.6 0.5 0.5 0.62 0.62 0.4 0.4 0.46 0.46 0.5 0.5 0.3 0.3 Percent Increase Percent Increase 0.2 0.2 0.1 0.1 0 0 US (90 Cities)* US (90 Cities)* Eur (21 Eur (21 Asia (6 Asia (6 Studies)* Studies)* Studies) Studies) Acute Mortality Responses to PM in US, Europe, and Asia Exposure Risks Exposure Response Huizenga et al., 2005
Address long-term, chronic effects Large populations in multiple cities enrolled and then followed for many years to determine disease or mortality experience Must control for “spatial” confounders, e.g., smoking, income, race, diet, occupation Assessment of confounders at individual level is an advantage over cross-sectional, “ecologic” studies Prospective Cohort Studies
Results from Harvard Six Cities Study • Long-term average concentrations of fine particle air pollution were associated with mortality rates, controlling for individual-level risk factors across six US cities Dockery et al., 1993
American Cancer Society Study Pope, C.A. et al., Journal of the American Medical Association: 287, 1132-1141, 2002 Source: Pope et al., 2002
American Cancer Society Cohort Study • Objective: • To assess the relationship between long-term exposure to fine particulate air pollution and all-cause, lung cancer, and cardiopulmonary mortality • Approach: • Vital status and cause of death data were collected by the American Cancer Society through 1998 in 500,000 US adults from 50 urban areas for whom air pollution exposure data were available in 1980
American Cancer Society Study Results Pope et al., 2002
American Cancer Study Conclusion • “Long-term exposure to combustion-related fine particle air pollution is an important environmental risk factor for cardiopulmonary and lung cancer mortality” Pope et al., 2002
PM2.5 PM10 10 μg/m3 annual mean25 μg/m3 24-hour mean 20 μg/m3 annual mean50 μg/m3 24-hour mean WHO 2005 Air Quality Guidelines: Particulate Matter World Health Organization, 2008d
Ozone (O3) 100 μg/m3 8-hour mean WHO 2005 Air Quality Guidelines: Ozone World Health Organization, 2008d
Average Ambient Air Quality Levels(2000-2003) Notes: Busan (2000-2002); Dhaka (2002-2003); Hanoi (2000-2002); Jakarta (2000-2001); Kathmandu (2003); Manila – PM10 (2002-2003); Mumbai (2000-2001); New Delhi (2000-2002); Osaka (2000-2001); Seoul (2000-2002), SPM (2000-2001); Surabaya (2001-2003) Tokyo (2000-2001) Clean Air Initiative, 2004 3 SO2 Limit = 50 µg/m3 (WHO, 1999) SPM Limit = 60-90 µg/m3 (WHO, 1979) SPM SO2 NO2 Limit = 40 µg/m3 (WHO, 1999) PM10 Limit = 50 µg/m3 (USEPA, 1997) PM10 NO2
Health Impact Assessment • Step 1. Model future environmental conditions under various emissions and/or climate scenarios • Step 2. Gather existing knowledge regarding human health impacts given a change in environmental conditions (based on “exposure-response” equations) • Step 3. Estimate health impacts of modeled environmental changes
Exposure-Response Calculations • Excess deaths attributed to PM is estimated by: • Where: • ∆y is the change in mortality incidence • y0 is the baseline mortality incidence, equal to the baseline incidence rate times the potentially affected population • β is the effect estimate • ΔPM is the change in PM2.5 STRATUS CONSULTING
Global Burden of Disease – WHO 2004 Cohen et al., 2004
Population Exposure to Particulate Matter Cohen et al., 2004
Estimates of the Health Impact of Particulate Matter Exposure Cohen et al., 2004
The Challenge for Air Pollution and Climate Change Can we assess potential future health impacts of air quality changes resulting from global climate change?
Effects of Climate Change on Tropospheric Ozone Formation • Formation reactions for ozone happen faster at high temperatures and with greater sunlight • Biogenic VOC emissions increase at higher temperatures • Regional air mass patterns over time and space may change, altering stagnation and clearance events • The mixing height of the lower atmosphere may change, affecting the dilution of pollution emitted at the surface
The New York Climate and Health Project Linking models for global and regional climate, land use and cover, and air quality… To examine the potential public health impacts of ozone under alternative scenarios of climate change and regional land use in the 2020s, 2050s, and 2080s in the New York City (NYC) metropolitan region
Approach • Develop exposure-response function for ozone using historical data from the NYC metropolitan area • Develop an integrated modeling system that includes modules for global climate, regional climate, and regional air quality • Examine alternative greenhouse gas growth scenarios • Combine scenarios to assess potential mortality risks in the NYC metro area in the 21st century
Developing NYC Exposure-Response Functions for Temperature and Ozone Outcome: All internal-cause daily deaths at county level (JJA: 1990-1999) β coefficient estimates (Standard Errors) Input to risk assessment POISSON Regression Day of Week (Indicator Variable); Spline of time Predictor: Daily ozone from 16 stations Model Outputs PREDICTOR: Daily mean temp. from 16 stations Final Model: log (daily deaths)= DOW + spline(time) + b1(mean Tlag0)1-3 + b2(max O3 lag0-1)
Modeling Domains Global climate (4 x 5) Health impacts Regional climate and ozone (36 km)
Impact of Climate Change on Summertime Ozone Concentrations 1990s ∆2020s Hogrefe et al., 2004 ∆2050s ∆2080s
Impact of Climate Change on Compliance with Ozone Standards Simulated changes in 8-hour standard exceedance days with climate change 1990s — 2020s
Modeled Changes in: Mean 1-hr max O3 (ppb) O3-related deaths (%) Knowlton et al., 2004
Review • The mixtures of air pollutants produced by burning of fuels can • Adversely affect human health • Promote climate change • In addition • Climate change can influence air pollution, resulting in direct health effects • Climate change can affect other aspects of air quality, including smoke from agricultural or wild fires, and aero-allergens like pollen and mold spores STRATUS CONSULTING
Furthermore • There are other “air pollutants” besides the ones which come out of tail pipes and smoke stacks which have important impacts on human health, and for which climate change is causing changes… STRATUS CONSULTING
Forest Area Burned and Temperature Trends Canada 1920-1999: 5-year Means Gillett et al., 2004
Start Date of Birch Pollen Season in Brussels 1970-2006Days after Jan 1 (5-year running means) Emberlin et al., 2002