Download
1 / 17
170 likes | 319 Vues
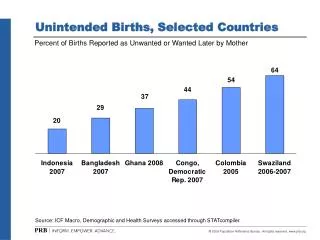
Total Births and Births to Teens by Race. Oklahoma, Tulsa County, and Oklahoma County 2002 through 2012. Prepared by the Community Service Council with support from The Metropolitan Human Services Commission Revised: November 5, 2013. Births by race. Births by Race: Oklahoma, 2002-12.

E N D
Total Births and Births to Teensby Race Oklahoma, Tulsa County, and Oklahoma County 2002 through 2012 Prepared by the Community Service Council with support from The Metropolitan Human Services Commission Revised: November 5, 2013
Births by Race: Oklahoma, 2002-12 Source: Oklahoma State Department of Health (OSDH), Center for Health Statistics, Health Care Information, Vital Statistics 2002 to 2012, on Oklahoma Statistics on Health Available for Everyone (OK2SHARE). Accessed at http://www.health.ok.gov/ok2share on 21OCT2013:11:39:07. Prepared by the Community Service Council, with support from the Metropolitan Human Services Commission (10/21/2013).
Births by Race: Tulsa County, 2002-12 Source: Oklahoma State Department of Health (OSDH), Center for Health Statistics, Health Care Information, Vital Statistics 2002 to 2012, on Oklahoma Statistics on Health Available for Everyone (OK2SHARE). Accessed at http://www.health.ok.gov/ok2share on 21OCT2013:11:39:07. Prepared by the Community Service Council, with support from the Metropolitan Human Services Commission (10/21/2013).
Births by Race: Oklahoma County, 2002-12 Source: Oklahoma State Department of Health (OSDH), Center for Health Statistics, Health Care Information, Vital Statistics 2002 to 2012, on Oklahoma Statistics on Health Available for Everyone (OK2SHARE). Accessed at http://www.health.ok.gov/ok2share on 21OCT2013:11:39:07. Prepared by the Community Service Council, with support from the Metropolitan Human Services Commission (10/21/2013).
Births to Teens by Race: Oklahoma, 2002-12 Source: Oklahoma State Department of Health (OSDH), Center for Health Statistics, Health Care Information, Vital Statistics 2002 to 2012, on Oklahoma Statistics on Health Available for Everyone (OK2SHARE). Accessed at http://www.health.ok.gov/ok2share on 21OCT2013:11:39:07. Prepared by the Community Service Council, with support from the Metropolitan Human Services Commission (10/21/2013).
Births to Teens by Race: Tulsa County, 2002-12 Source: Oklahoma State Department of Health (OSDH), Center for Health Statistics, Health Care Information, Vital Statistics 2002 to 2012, on Oklahoma Statistics on Health Available for Everyone (OK2SHARE). Accessed at http://www.health.ok.gov/ok2share on 21OCT2013:11:39:07. Prepared by the Community Service Council, with support from the Metropolitan Human Services Commission (10/21/2013).
Births to Teens by Race: Oklahoma County, 2002-12 Source: Oklahoma State Department of Health (OSDH), Center for Health Statistics, Health Care Information, Vital Statistics 2002 to 2012, on Oklahoma Statistics on Health Available for Everyone (OK2SHARE). Accessed at http://www.health.ok.gov/ok2share on 21OCT2013:11:39:07. Prepared by the Community Service Council, with support from the Metropolitan Human Services Commission (10/21/2013).
Fertility Rates by Race: Oklahoma, 2002-12 Fertility Rate = live births to women 15-44 per 1,000 females age 15-44 Source: Oklahoma State Department of Health (OSDH), Center for Health Statistics, Health Care Information, Vital Statistics 2002 to 2012, on Oklahoma Statistics on Health Available for Everyone (OK2SHARE). Accessed at http://www.health.ok.gov/ok2share on 21OCT2013:11:39:07 and 04NOV2013. Prepared by the Community Service Council, with support from the Metropolitan Human Services Commission (11/5/2013).
Fertility Rates by Race: Tulsa County, 2002-12 Fertility Rate = live births to women 15-44 per 1,000 females age 15-44 Source: Oklahoma State Department of Health (OSDH), Center for Health Statistics, Health Care Information, Vital Statistics 2002 to 2012, on Oklahoma Statistics on Health Available for Everyone (OK2SHARE). Accessed at http://www.health.ok.gov/ok2share on 21OCT2013:11:39:07 and 04NOV2013. Prepared by the Community Service Council, with support from the Metropolitan Human Services Commission (11/5/2013).
Fertility Rates by Race: Oklahoma County, 2002-12 Fertility Rate = live births to women 15-44 per 1,000 females age 15-44 Source: Oklahoma State Department of Health (OSDH), Center for Health Statistics, Health Care Information, Vital Statistics 2002 to 2012, on Oklahoma Statistics on Health Available for Everyone (OK2SHARE). Accessed at http://www.health.ok.gov/ok2share on 21OCT2013:11:39:07 and 04NOV2013. Prepared by the Community Service Council, with support from the Metropolitan Human Services Commission (11/5/2013).
Age-Specific Teen Fertility Rates by Race: Oklahoma, 2002-12 Age-Specific Fertility Rate = total live births to women in specified group per 1,000 females in group Source: Oklahoma State Department of Health (OSDH), Center for Health Statistics, Health Care Information, Vital Statistics 2002 to 2012, on Oklahoma Statistics on Health Available for Everyone (OK2SHARE). Accessed at http://www.health.ok.gov/ok2share on 21OCT2013:11:39:07. Prepared by the Community Service Council, with support from the Metropolitan Human Services Commission (10/21/2013).
Age-Specific Teen Fertility Rates by Race: Tulsa County, 2002-12 Age-Specific Fertility Rate = total live births to women in specified group per 1,000 females in group Source: Oklahoma State Department of Health (OSDH), Center for Health Statistics, Health Care Information, Vital Statistics 2002 to 2012, on Oklahoma Statistics on Health Available for Everyone (OK2SHARE). Accessed at http://www.health.ok.gov/ok2share on 21OCT2013:11:39:07. Prepared by the Community Service Council, with support from the Metropolitan Human Services Commission (10/21/2013).
Age-Specific Teen Fertility Rates by Race: Oklahoma County, 2002-12 Age-Specific Fertility Rate = total live births to women in specified group per 1,000 females in group Source: Oklahoma State Department of Health (OSDH), Center for Health Statistics, Health Care Information, Vital Statistics 2002 to 2012, on Oklahoma Statistics on Health Available for Everyone (OK2SHARE). Accessed at http://www.health.ok.gov/ok2share on 21OCT2013:11:39:07. Prepared by the Community Service Council, with support from the Metropolitan Human Services Commission (10/21/2013).