Download
1 / 18
180 likes | 374 Vues
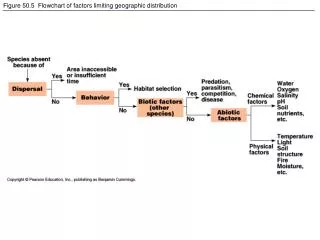
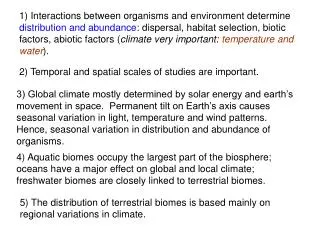
1) Interactions between organisms and environment determine distribution and abundance : dispersal, habitat selection, biotic factors, abiotic factors ( climate very important: temperature and water ). 2) Temporal and spatial scales of studies are important.

E N D
1) Interactions between organisms and environment determine distribution and abundance: dispersal, habitat selection, biotic factors, abiotic factors (climate very important: temperature and water). 2) Temporal and spatial scales of studies are important. 3) Global climate mostly determined by solar energy and earth’s movement in space. Permanent tilt on Earth’s axis causes seasonal variation in light, temperature and wind patterns. Hence, seasonal variation in distribution and abundance of organisms. 4) Aquatic biomes occupy the largest part of the biosphere; oceans have a major effect on global and local climate; freshwater biomes are closely linked to terrestrial biomes. 5) The distribution of terrestrial biomes is based mainly on regional variations in climate.
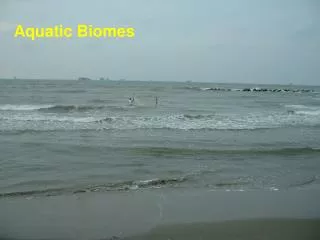
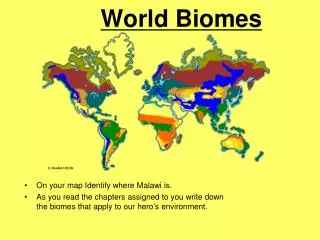
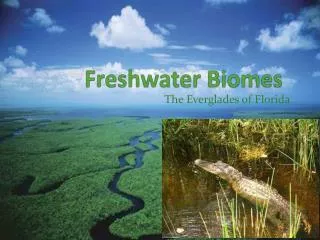
Largest component. Vertical stratification: light, temperature, salinity, density. Oceans (3% salt): rainfall, climate, wind. Give O2 and take CO2. Freshwater (< 1% salt): linked to soil and biota of terrestrial biomes. Aquatic Biomes Fig. 50.17 pages 1106-1109
Ocean zonation Fig. 50.22 Distance to shore & water depth, light penetration, substrate. pages 1109-1112
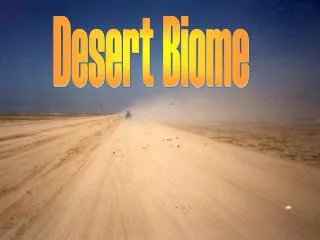
Terrestrial Biomes Determined by climate: latitudinal and regional patterns. Vertical stratification based on vegetation. Characteristic life forms. Gradation in boundaries: ecotone. Dynamic, not stable. Fig. 50.24 pages 1112-1113
SOME questions from February 8th 1- Are we going to be tested on material that you have not covered in lecture? 2- When will the review sheet be posted? Will we have a study/review session? 3- Will there be questions about the third article on the test? 4- Do any chemicals evaporate with water or does water always separate from anything it is mixed with? 5- What is the Ekman transport vector? Why is it important? 6- What are the lowest points in the ocean? What could possibly live there?
Chapter 52- Population Ecology Population ecology limiting factors Organismal ecology coping Community ecology interspecific interactions and diversity Ecosystem ecology energy flow and chemical cycling Landscape ecology effects on interactions at lower levels Biosphere ecology global effects
Population: Group of individuals of the same species occupying the same general area. 67,171- 2000 Census 71,080- 2004 Estimate Density. Dispersion. pages 1151-1152
Fig. 52.2 Uniform page 1153 Clumped Dispersion Patterns Random
Changes in Population Size pages 1153 (1154) Additions (+) Natality (births). Immigration. Subtractions (-) Mortality (deaths). Emigration. Demography:Studies vital statistics that affect population size. Life Histories Island of Rhum, Scotland Reproductive success. Number of surviving offspring produced by an individual and that reach reproductive age. Natural selection. Differences in reproductive success due to heritable differences in individuals. Life histories. Patterns of resource allocation to maintenance (survival), growth, and reproduction. Fig. 52.5 Individuals expected to behave so as to promote their own RS. pages 1156-1158
Life Histories Iteroparity. Semelparity (“once” and “beget”) (“repeat” and “beget”) Three basic life history “decisions” (remember not conscious choice except us): -When to begin reproducing? -How often to breed? -How many offspring to produce during each reproductive episode? TID page 1156
Population Growth Finite rate of increase population is growing ( >1 ) population is declining ( <1 ) zero population growth ( 1 ) λ = number of individuals at time t + 1 divided by number of individuals at time t population is growing ( r+ ) population is declining ( r- ) zero population growth ( r = 0 ) Instantaneous rate of change r = ln λ r % change Nt Nt+1 λ 0.87 -0.14 -13 1.15 0.14 15 1 0 0 pages 1158-1159
dN = rmaxN dt Population Growth Exponential model Ideal conditions: population growth constrained only by life history. rmax = maximum growth rate for the species Intrinsic rate of growth rate exponential population growth or geometric population growth pages 1159-1160
K - N dN K - N = rmaxN K dt K Population Growth Logistic model There is a limit to number of individuals that can occupy a habitat. Carrying capacity (K).Maximum population size an environment can support at a time with no habitat degradation. Not a fixed value. Population growth rapid when population size well below K, slow when close to K and zero when at K. K = 100; N = 1; (K-N)/K = 0.99 K = 100; N = 90; (K-N)/K = 0.1 K = 100; N = 100; (K-N)/K = 0 pages 1160-1161
Population Growth Number of individuals r = 0.02 r = 0.02 Time Exponential curve. Population grows indefinitely. S-shaped curve. Population growth levels off as population size approaches carrying capacity. pages 1161-1162
Halichoerus grypus Sable Island, CAN ICES J. Mar. Sci. 2003 Phoca vitulina pages 1162-1163 J. Wildl. Manage. 2003
Population-Limiting Factors Many factors cause changes in birth and death rates in relation to population density: increased predation, competition for food or space, stress, parasitism, etc; slowing population growth rate. Eubalaena glacialis Why do they represent an example of negative feedback? Food-limited CRESLI Mandarte Isl., BC Fig. 52.14 pages 1164-1165
Dynamics of Populations They result from the interaction between biotic and abiotic factors. Long-term studies indicate that such factors make natural populations unstable. Assigned paper to read for Quiz IV. Isla Royale, Michigan Fig. 52.17 pages 1165-1167
Fig. 52.19 -Geographic variations due to large-scale climate effects (apparent lack of lynx migration between regions). PNAS 2004 -Fluctuations of food species. -Predation by various species. -Hare fluctuations. Some populations have regular boom-and-bust cycles. pages 1167-1168