Nutrition Environment Measures Survey
490 likes | 762 Vues
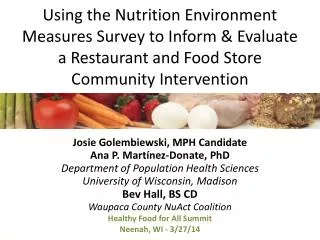
Nutrition Environment Measures Survey. NEMS-S, NEMS-R and NEMS-V. Funded by the. NEMS tools are research tested, valid and reliable instruments: NEMS-S: Stores NEMS-R: Restaurants NEMS-V: Vending machines.

Nutrition Environment Measures Survey
E N D
Presentation Transcript
Nutrition Environment Measures Survey NEMS-S, NEMS-R and NEMS-V Funded by the
NEMS tools are research tested, valid and • reliable instruments: • NEMS-S: Stores • NEMS-R: Restaurants • NEMS-V: Vending machines NEMS…* was originally developed for research* can be used for community assessment, advocacy, and intervention
What does NEMS measure? • Community and Consumer Nutrition • Environments • Community nutrition environments = • Type & location of food outlets • Accessibility (e.g., hours, drive-thru) • Consumer nutrition environments = • Availability of healthful food choices • Pricing, promotion, placement • Information availability
Measures of the Nutrition Environment in Stores • NEMS-S Measures: • Availability • Of healthful choices • Price • Healthy vs. less healthy • Grocery vs. convenience stores • Quality • For fresh produce
Measures of the Nutrition Environment in Stores Core Categories of Foods Milk Ground Beef Baked Goods Fruits Hot Dogs Bread Vegetables Frozen Dinners Chips Soda Fruit Juice Cereal
Vegetables PREFERRED item (packaged) First alternate item (loose) Last alternate item (baby, bagged)
Where Are We Measuring? The Type of Restaurant: • Sit-Down (SD) Restaurants - Offers table service with wait staff who take your order at the table. • Fast-Casual (FC) Restaurants - Similar to fast food although generally has higher quality of food. Order and pay at the counter but food is often delivered to table. • Fast-Food (FF) Restaurants - Minimal service and food is supplied quickly after ordering.
What Are We Measuring? • Availability of healthy foods • Entrees and main dish salads • Side dishes • Fruits • Non-fried vegetables • Baked chips • Whole grain bread • Children’s menu options • Beverages
Barriers to healthful eating All-you-can-eat Promotions Super-sized items Discouraging special requests Facilitators to healthful eating Healthy entrée notations Offering reduced portions Marketing Promotions/signs for healthful and/or unhealthful eating Pricing Are healthy foods more or less expensive than their unhealthy counterparts? What Are We Measuring? (cont’d)
Measures of Nutrition Environments in Restaurants< Fast-Food & Sit-Down Restaurants > Sources of Information: • Internet • Menu • Visit, observation • Interview manager
Items to Rate/Count: • Number of main dishes and salads • Number of healthy options • Salad dressing, fruit and non-fried vegetables • Facilitators and barriers • Differentials in pricing • Kid’s menu
2) Count the salads with 2 or less high-fat ingredients Avocado or guacamole Cheese Eggs (if already have a protein source) Nuts Pesto Sour cream Bacon Croutons Fried Crispy Noodles, tortilla strips (or similar fried garnishes) Olives Salami, pepperoni, or other high-fat lunch meat Counting Main Dish Salads How to Count Healthy Options: 1) Use nutrition information or any symbols indicating salad is healthy option If there are no low-fat or fat-free salad dressings available, then no salad can be counted as healthful.
Counting Fruit • Only count fruit without added sugar • Fresh fruit or canned fruit (in fruit juice) • Fresh fruit compote • Fresh fruit salad without dressing (or on the side) • Fresh fruit with plain or non-fat yogurt • Fresh fruit plate with cottage cheese • Fresh fruit on the salad bar
YES Raw (e.g., sliced tomato) Steamed Grilled or char-grilled Baked Pickled NO Mixed dishes or casseroles Fried, stir-fried Breaded or “au gratin” Creamed or with sauce Scalloped Glazed or buttered Potatoes Pinto beans or other legumes Non-fried Vegetables (w/out added sauce)
Beverages • Record if other healthful or low-calorie beverages are available (< 40 calories per serving) • 100% fruit juices • Low-fat, skim, or non-fat milk
Simple Data Analysis Tools • NEMS-S and NEMS-R scoring sheets • NEMS-S and NEMS-R excel spreadsheets • Sample graphs
Developed to assess workplace vending machines Based on the Institute of Medicine’s (IOM) nutrition standards for schools Intended to have an easy to use coding system: red, yellowand green Nutrition Environment Measures Survey Vending - NEMS-V
Developed by Susan Klein of Iowa State University Extension and Carol Voss of the Iowa Department of Public Health Funding provided by the Wellmark Foundation Consulted with NEMS staff - Karen Glanz, PhD, MPH and Margaret Clawson, MPH, UPenn Reliability testing completed in September, 2011 NEMS-V: Development & Pilot-testing
REDfood and beverages are not as healthy and fall outside the Dietary Guidelines for Americans. YELLOWfood and beverages are healthy foods that meet the Dietary Guidelines, but do not provide a serving of fruit, vegetable, low-fat dairy or whole grain. GREEN food and beverages are considered the healthiest, are consistent with the Dietary Guidelines for Americans and provide a serving of fruit, vegetable, low-fat dairy or whole grain. A healthy choice calculator is available on website if one can’t figure out if the product is coded red, yellow or green. NEMS-V Coding NEMS-V Coding
GreenFood Criteria Green- Provides at least one serving of fruit, vegetable, and/or whole grains or non-fat/low-fat dairy products and meets the Dietary Guidelines for Americans. Must also meet all of the following criteria: • ≤200 calories per portion as packaged • No more than 35 percent of total calories from fat • <10 percent of total calories from saturated fat • Zero trans fat (less than or equal to 0.5 grams per serving • ≤35 percent of calories from total sugars, except for yogurt with no more than 30 grams of total sugars, per 8 oz portion as packaged • Sodium content of 400 mg or less per portion as packaged
Yellow&RedFood Criteria Yellow– Criteria is the same as Green, but does not provide at least one serving of fruit, vegetable, and/or whole grains or non-fat/low-fat dairy products, but also does meet the Dietary Guidelines for Americans. Red- Does not meet green or yellow criteria.
Vending Location Cover Page: 9 questions about worksite and vending machines (who stocks, gets profit, etc.) Individual Machine Cover Page: 9 questions related to the machine (type of machine, location, accessibility, etc.) Individual Machine Graphic: Tracks the number and products to record for each machine. Food & Beverage Recording Sheet: record each item, size, price, category of beverage, fruit/vegetable/refrigerated, salty, sweet, ns entrees/sandwiches, and its NEMS-V code. NEMS-V Tool
www.nems-v.com Website intended to guide an employee of a company through all of the steps from the initial assessment to how to go about changing some of the products in the machines. Tips and guidance are offered on how to communicate with a vendor (the stocker of the machine) and renegotiate the contract. Success stories are highlighted. NEMS-V Website
NEMS-V Website Features • NEMS-V Tools Tutorial: 15 minute online demonstration on how to complete a NEMS-V assessment • NEMS-V Healthy Choices Calculator Tutorial: 5 minute online demonstration on how to use the Healthy Choices Calculator to determine green, yellow, or red food/beverage choices • Ready to complete graphic for displaying vend #, color code and/or calories for each machine
NEMS-V Website Features Provides an award certificate for each machine and the location • Bronze award - if at least 30% of the food or beverage choice are yellow or green; • Silver award if at least 40% are yellow or green; • Gold award if at least 50% are yellow or green and without unhealthy advertising • Generates a report card for each machine and location • Indicates how many food and beverage items need to be changed to green or yellow choices to earn a Bronze, Silver or Gold award • Provides a checklist of action steps for making healthier choices available in vending machines
Reliability Testing • Results demonstrate that the website tutorial can be an effecting teaching tool and that the NEMS-V assessment tool is reliable. • There was high percentage of agreement for both product and color between rater groups (A versus B) and time (time 1 versus time 2). • While both product and color agreements have reliable results; the product agreement is relatively higher than the color agreement.
Mini Grants in Iowa • $500 mini-grants provided to 11 communities in spring 2010 • $1,000 mini-grants awarded in spring 2011 • $500 mini-grants to local public health agencies in spring 2012 • Benefits of providing mini grants • Immediate use of tools following training • Help to determine reach of your nutrition environment and fruit and veggie efforts • Give communities a format/platform to begin nutrition assessment work • We paired NEMS-V with Walkability mini grants to cover both nutrition and physical activity
Message Development for NEMS-V • Social marketing planning process to motivate individuals to make healthy choices in the vending machines • Face-to-face interviews at worksites and rest areas • Online focus groups • Message development • Testing
Focus Group Findings • White Collar Employees were very likely to say they paid attention to nutrition labels with 19 of 24 (79%) in the respondent sample saying they looked at labels at least some of the time. • White collar respondents were more often “rationalizing” their snack indulgences, either because it was the “wiggle room” in their overall approach to eating or because they exercised regularly which allowed for their indulgences.
Focus Group Findings (cont.) • Many respondents seemed to give themselves permission to ignore everything they know about nutrition and just pick “junk”. Others visit the vending area with very low expectations for nutritious offerings, leaving empty-handed or generally avoiding the vending machines altogether. • Respondents said “sometimes you just NEED CHOCOLATE!” One of the most frequently selected snacks and most ardently defended was chocolate – Snickers and M&M’s were popular in this category.
Message Selected Nearly 6 in 10 respondents thought message worked best to communicate the snack rating system clearly. Respondents liked that it illustrated examples of foods, which made the color coding system very clear. The main message was focused on encouraging people to choose better snacks at least some of the time. Many noted they had never seen vending machines with healthy options stocked in them.
White Collar Results 10.3% shift of sales. Sales volume = 31.1%; represents 30% of space
Sustaining Healthy Vending • Project will lead to having a policy in place for state facilities to provide a minimum of 30% of food and beverage choices in vending machines as healthy options based on NEMS-V criteria • Project will serve as a model for other businesses across the state.
Where Are We Now? • Converting all machines on the Capitol Complex to include 30% healthy options (13 buildings) • Closely working with suppliers and vendors who supply products to these buildings to identify healthy options • Iowa Comprehensive Cancer- Healthy Vending and Salad Bars in Private and Public Worksites • 21 worksites in 12 counties; 6 government sites • Provide sites with all signage, newsletter templates for blue and white collar, vending scorecard, table tents, restroom signs • $150 for incentives; $100 for taste testing • Implementation timeframe – January through May 2013
Progress toward Procurement • Governor announced implementation of American Heart Association guidelines – February 2012 • IDPH and AHA met with governor’s staff in August with goal of implementation of procurement guidelines for state facilities • Tasked to research procurement procedures • Randolph Sheppard Act - Iowa Dept. For The Blind • Inventory procurement contracts through Dept. of Administrative Services • Meeting with state facilities food service directors on Wednesday to introduce concept and ask for representatives to serve on task force • Actions – set up a task force to work with DAS on food service contracts
Resources • NEMS-S and NEMS-R • www.med.upenn.edu/nems • Background articles • Info on NEMS- S and NEMS-R • Link to the Online Training • NEMS Materials Karen Glanz, PhD, MPH - UPenn Margaret Clawson, MPH - UPenn • NEMS-V • www.nems-v.com • Intended to be a complete training tool, from initial assessment to implementing changes Carol Voss – IDPH Susan Klein – IDPH
Iowa Department of Public HealthIowans Fit for LifeCarol Voss 515-242-5566carol.voss@idph.iowa.govSusan Klein515-240-0368susanklein50@gmail.com