Download
1 / 21
220 likes | 569 Vues
Techniques for Mapping In-River Geomorphology, Sediment Transport and River Bank Structures. Robert Feldpausch, Principal Scientist/Hydrographer (Tetra Tech) - Presenter Brent Johnston, Senior Sonar Specialist (Tetra Tech) Brian Blevins, Survey Business Development Manager, PLS (Tetra Tech) .

E N D
Techniques for Mapping In-River Geomorphology, Sediment Transport and River Bank Structures Robert Feldpausch, Principal Scientist/Hydrographer (Tetra Tech) - Presenter Brent Johnston, Senior Sonar Specialist (Tetra Tech) Brian Blevins, Survey Business Development Manager, PLS (Tetra Tech)
Overview • Mapping systems and methods • Global and attitude positioning systems/sensors • Multi-channel single beam echosounder (sweep) • Multibeam echosounder • Vessel-mounted LiDAR and cameras • Data products and analysis • Point clouds, grids, digital terrain models, contours • GIS and ACAD charts and models • Data repeatability over time • Examples of data use
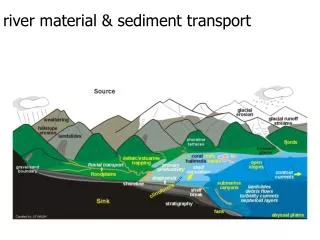
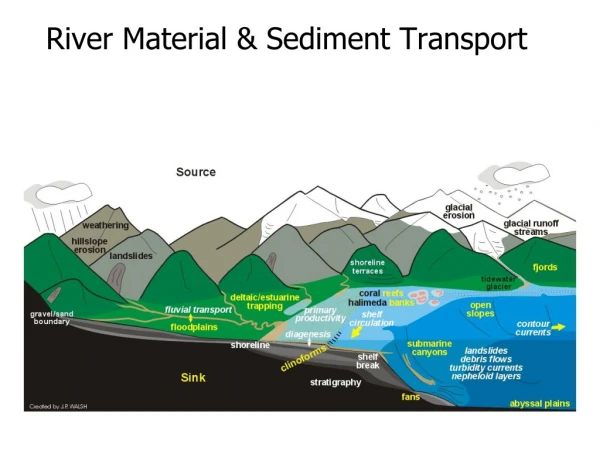
In-River Mapping Objectives Primary Goals • Support sediment investigations, surface water modeling, and remediation design, implementation, and monitoring • Support construction design, implementation, and monitoring Secondary Goals • Delineate depositional and erosional areas, evaluate stability, and correlate analytical data • Map river bank structures, cultural artifacts, and utilities • Define sediment bottom types
Global and Attitude Positioning Systems • Global Navigation Satellite Systems • Sub cm accuracy (RTK GPS static) • NAVSTAR (US - GPS) - 24 • GLONASS (Russian) - 23 • XYZ positioning, vessel squat, and settlement • Inertial and Attitude Systems • Vessel heave, pitch, roll, yaw compensation • Sound Velocity Sensors • Sonar speed of sound corrections
Full or partial bottom coverage w/ moderate resolution in shallow water Higher resolution than single beam, but lower than multibeam More efficient than multibeam in shallow water Efficient mapping in 1- to 8-ft water depth Fixed ~25-ft swath regardless of water depth River Shoals: Multi-channel Echosounder
Multi-channel Data Example ~0 – 10-ft depth range 3.5 x 0.5 mile reservoir
River Channel: Multibeam Echosounder • Full bottom coverage, high resolution • Higher resolution than multi-channel and single beam (over 250 beam up to 50 pings/sec) • More efficient than multi-channel in > 8 ft depth water • Swath varies by water depth (~3.5x water depth)
Each system rotated 30 degrees Data collection under structures, up bank to water surface (180° swath) Orientation increases coverage and efficiency in channelized areas Survey of either bank, up, or down river River Channel and Bank: Dual Multibeam Echosounder
River Bank:Vessel-mounted LiDAR • Maps river bank with full coverage • Resolution similar to multibeam plus photos/video • Continuous terrain model of river bank, bottom and under structures with multibeam and/or multi-channel (260° swath)
Vessel-mounted LiDAR and Multibeam • Construction and design support and drawings for terrain and debris avoidance • As-built drawings
River Bank: Vessel-mounted Camera • Geo-referenced photo/video collected with VML • Interactive GIS with hyperlinked photos • Snapshot of project conditions and above water features
Data Repeatability • Repeatability on the order of 0.1 to 0.2 ft in shallow water 0 to 30 ft (More than a pretty picture) LFR OU5 Bathymetry 2008 vs. 2010 LFR OU4 N Bathymetry 2004 vs. 2008 • Average = 0.01 ft • Median = 0.04 ft • SD = 1.4 ft • Range = -23.0 to 28.4 ft • N = 4 million • Average = 0.11 ft • Median = 0.16 ft • SD = 0.78 ft • Range = -5.6 to 3.4 ft • N = 3 million
Time Series Bathymetry Data • Short and long term monitoring • Same area and comparable survey methods • Time lapse of minutes, hours, months or years • Various triggers to implement survey • Flow conditions/floods – sediment transport studies • Construction/dredging planning prior implementation • Operations, Maintenance and Monitoring Plan (OMMP)
Time Series: Before & After Dredge • Monitor and evaluate dredge effectiveness and changes in bottom elevations (areas adjacent to dam and fish ladder) • Dual multibeam surveys 2009 2011
Time Series: Before & After Dredge 2009 (green) / 2011 (yellow) • 300-ft • 80-ft 2009 2011
Annual Comparisons: OMMP 2004 2006 2008 Environmental sediment cap monitoring Single beam and multibeam surveys
Time Series Data: Difference Plots 2006 - 2004 2008- 2006 Sediment cap OMMP - Deposition, scour, and settling of sediment cap
Summary Mapping Technologies • High-accuracy GPS positioning and vessel attitude • Multi-channel echosounders – shoal areas • Multibeam echosounder – channels, structure and banks • Vessel-mounted LiDAR and photos – banks and structures GIS Data Integration, Products, and Analysis • Integrated multi-channel, multibeam, LiDAR, and photos • Point clouds, grids, digital terrain models, contours, design models and georeferenced and hyperlinked photos • River geomorphology, sediment transport, and river bank structures