Download
1 / 27
280 likes | 463 Vues
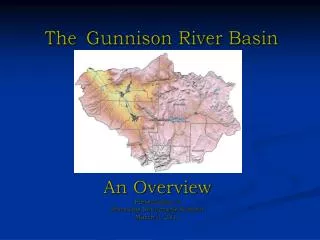
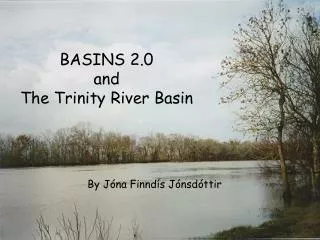
Sediment in the Trinity River Basin. Virginia Smith CE397 – Spring 2009. Outline. The Trinity River Basin Sediment Data Trends of the Main Channel Trends of the Catchments Conclusions. The Trinity River Basin. Large population and growing Lots of agriculture

E N D
Sediment in the Trinity River Basin Virginia Smith CE397 – Spring 2009 Virginia Smith CE 397
Outline • The Trinity River Basin • Sediment Data • Trends of the Main Channel • Trends of the Catchments • Conclusions Virginia Smith CE 397
The Trinity River Basin • Large population and growing • Lots of agriculture • 80-90% of the basin’s water supply is from surface water • 28 water supply reservoirs • The first was in 1911 • The master planning has 13 remaining reservoirs to built Virginia Smith CE 397
Sediment Data in the Basin Virginia Smith CE 397
Classifying the Gages Virginia Smith CE 397
Mainstream Sediment Gages Virginia Smith CE 397
Sediment Rating Curves Virginia Smith CE 397
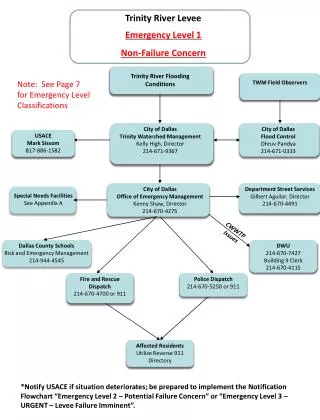
Dam Influence Virginia Smith CE 397
Dam Influence Virginia Smith CE 397
Catchment Sediment Gages Virginia Smith CE 397
Delineating Catchments Virginia Smith CE 397
Natural Regions Virginia Smith CE 397
Land Cover Virginia Smith CE 397
Data Attached to Counties Virginia Smith CE 397
Regression • Variables Collected • Hill slope • Storm Depth • Vegetation Density • Precipitation • Precipitation Intensity • Urban Land • Agricultural Land • Forested Land • Variance Inflation Factors Virginia Smith CE 397
Correlation • Precipitation / Precipitation Intensity / Vegetation Cover Density • Hill slope/Erosion Rate • Agriculture and Forest Land Virginia Smith CE 397
Regression • SAS • Conc. = Hill slope*(5.16) t=5.16 R2=0.792 p-value = 0.0013 F = 26.65 • Excel matched the results of SAS Virginia Smith CE 397
Conclusions • Sediment Rating Curves: a greater slope means a higher concentration • Dams have influenced the transport of sediment in the main channel • Hill slope is the main influence of sediment in the Trinity River Basin Virginia Smith CE 397
Questions Virginia Smith CE 397
Mainstream Flow Duration Curves Virginia Smith CE 397
SAS Regression Data Virginia Smith CE 397
Excel Regression Data Virginia Smith CE 397
Storm DepthData • Storm Depth • Rainfall depth during a storm • L moment statistics • Based on hourly rainfall during the storm duration • Data • Data by county • Data in inches Virginia Smith CE 397
Correlation Virginia Smith CE 397
NCRS Dams Virginia Smith CE 397