BASINS 2.0 and The Trinity River Basin
140 likes | 308 Vues
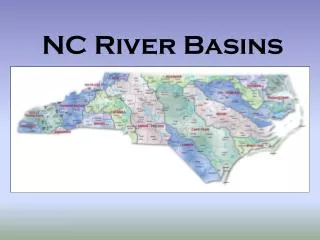
BASINS 2.0 and The Trinity River Basin. By Jóna Finndís Jónsdóttir. Outline. Why this project? Area of study What is BASINS 2.0 Running NPSM Conclusions. Lets talk about TMDL. My research project is a part of a Total Maximum Daily Loads project on the Trinity River Basin in east Texas.

BASINS 2.0 and The Trinity River Basin
E N D
Presentation Transcript
BASINS 2.0andThe Trinity River Basin By Jóna Finndís Jónsdóttir
Outline Why this project? Area of study What is BASINS 2.0 Running NPSM Conclusions
Lets talk about TMDL My research project is a part of a Total Maximum Daily Loads project on the Trinity River Basin in east Texas BASINS 2.0 is sometimes used to view and process data regarding TMDL projects Since the product of my research project will be used in a similar way as the data in BASINS, a quick inspection of the program will give me a better overview over my research
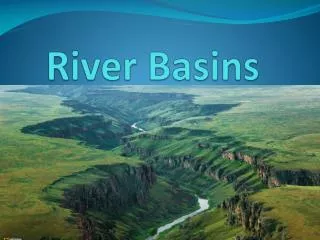
And the study area is… Or actually a part of the Trinity River Basin… First I was looking at the West Fork Trinity River Above Bridgeport Reservoir, segment number 812 The river network was to complicated for the non-point source model My next choice was Clear Fork Trinity River Above Lake Weatherford, segment number 833
Better Assessment Science IntegratingPoint and Nonpoint Sources • The BASINS system is basically an Arc View project with some extra components. • It consists of • An environmental database • Tools for data queries and report generation • Ability to produce input files for three models • The models, NPSM, Qual2e and Toxiroute • Post-processors for viewing of outputs from the models
The Database • Environmental Monitoring Data • Water Quality Monitoring Stations and Data summaries • Bacteria Monitoring Stations and Sata Summaries • Water Quality Stations and Observation Data • National Sediment Inventory Stations and Database • Listing of Fish and Wildlife Advisories • Flow Gage Sites • Weather Station Sites • Drinking Water Supply Sites • Watershed Data Stations and Database • Classified Shellfish Areas • Base Cartographic Data • Hydrologic Unit Boundaries • Major Roads • Populated Place Locations • Urbanized Areas • State and County Boundaries • EPA Regions • Environmental Background Data • Ecoregions • State soil and Geographic Database • Reach file 1 • Reach file 3 • Digital Elevation Model • Land Use and Land Cover • Point Source/Loading Data • Permit Compliance System, Sites & Computed Annual Loadings • Industrial Facilities Discharge Sites & Pollutant Release data • Superfund National Priority List Site • Resource Conservation & Recovery Information System Sites • Minerals Availability System /Mineral Industry Location System
Data Queries and Report Generation Target performs a broad-based assessment on the entire project area Assess is used to assess data on an individual watershed or a limited set of watersheds Data mining generates dynamic links between tables and maps for individual water quality stations or permitted facility discharges
The Stream Water Quality Models Two simple one-dimensional, steady-state models are are within BASINS, QUAL2E and TOXIROUTE BASINS creates input files for these models and has an built-in visualization for their output files. QUAL2E uses complex algorithms to simulate biochemical oxygen demand, dissolved oxygen, temperature, conservative and non-conservative substances Does not run in Windows NT TOXIROUTE calculates final and average concentration of general water quality constituents based on a dilution and first-order decay algorithm Will not be included in next edition of BASINS
Nonpoint Source ModelNPSM NPSM is capable of integrating both: Nonpoint source runoff and associated pollutant loadings Point source discharges BASINS can create an input file for the model, which describes the attributes of a selected watershed The input file describes: The river reach network: length, slope and flow/water level curves (from Rf1) The land use of watersheds Point source discharges A separate data file includes weather data from certain weather stations In the NPSM-postprocessor, measured data can be compared to the output from the model
Output from NPSM USGS Flow Gage Station & Surface Water Quality Station
Conclusions The BASINS system is in most ways interesting and easy to use Except for the models The fact that QUAL2E is not compatible with Windows NT should be presented in a more obvious way than it is (one sentence in the users guide) NPSM should give the user some error messages or instructions when the model can not run due to some mistakes in the input