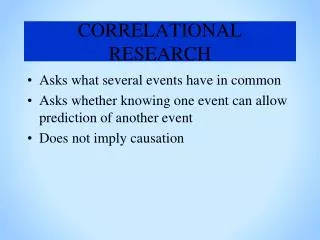
Correlational Research
Correlational Research. Inferential/Descriptive Statistic (r). Describes strength of linear relation between two variables. Strength of relation = degree of association. Does knowing an individual’s score on A tell you much about that individual’s score on B? How much does it tell you?.

Correlational Research
E N D
Presentation Transcript
Correlational Research Inferential/Descriptive Statistic (r) Describes strength of linear relation between two variables Strength of relation = degree of association Does knowing an individual’s score on A tell you much about that individual’s score on B? How much does it tell you? Some properties of r Ranges between -1 and 1 inclusive Sign (+ or -) gives direction of relation Absolute value gives strength r2 gives proportion of variance accounted for
Correlations Correlation between VIQ and PIQ = +.53 Characterized as strong and positive
Correlations Correlation between C and Behavioral Impulsivity = -.41 Characterized as moderate-strong and negative
Correlations Correlation between C and Family SES = -.15 Characterized as weak-negligible
Correlational Research • Disadvantages: • correlation does not indicate causation • 2) problems with self-report method • Advantages: • 1) can collect much information from many subjects at one time • 2) can study a wide range of variables and their interrelations • 3) study variables that are not easily produced in the laboratory
Correlational Research • Definition: • Seeks to establish a relation/association/correlation between two or more variables that do not readily lend themselves to experimental manipulation • Disadvantages: • 1) correlation does not indicate causation (6slide causation example) • 2) problems with self-report method • Advantages: • 1) can collect much information from many subjects at one time • 2) can study a wide range of variables and their interrelations • 3) study variables that are not easily produced in the laboratory
Correlation is not Causation Three ways in which A and B may be causally related A causes B (either directly or indirectly) A B B causes A (either directly or indirectly) B A A third variable causes both A and B A C B
Correlations Inform Causation Causation implies Correlation If A and B are causally related, they must be correlated Design or theory informs direction of influence Longitudinal design Experimental design Appeal to strong theory Can model third variable effects Specify and measure likely third variables Control for third variables in model If association between A and B remains, then third variable explanation does not hold
Case In Point • Lynam, D.R., Moffitt, T.E., & Stouthamer-Loeber, M.A. (1993). • Explaining the relation between IQ and delinquency: Class, race, test motivation, school achievement, or self-control? Journal of Abnormal Psychology, 102, 187-196. IQ is negatively correlated with delinquency Think of some ways this relationship could work. In other words, why or how might lower IQ be related to delinquency? What are other possibilities?
Third Variables? What are the likely candidates? Social Class Race Impulsivity What happens when they are included? Original r = -.25 Partial r = -.15 Significant relation remains
IQ Delinquency via School Achievement? What happens when school achievement is included?
Correlational Research • Definition: • Seeks to establish a relation/association/correlation between two or more variables that do not readily lend themselves to experimental manipulation • Disadvantages: • 1) correlation does not indicate causation • 2) problems with self-report method • Advantages: • 1) can collect much information from many subjects at one time • 2) can study a wide range of variables and their interrelations • 3) study variables that are not easily produced in the laboratory
Correlational Research Example Reformulated learned helplessness: When people find they are helpless, they ask why • three dimensions of causal attributions • internal-external • specific-global • stable-unstable internal, global, and stable attributions lead to depression Attributional Style Questionnaire Should find correlation between I, S, G attributional style and level of depression
Attributional Style Questionnaire You have been looking unsuccessfully for a job for some time. 1. Write down one major cause. 2. Is the cause of your unsuccessful job search due to something about you, or to, something about other people or circumstances ? Totally due Totally due to others 1 2 3 4 5 6 7 to me 3. In the future, when looking for a job, will this cause again be present? Will never again Will always be present1 2 3 4 5 6 7be present 4. Is this cause something that influences just looking for a job, or does it also influence other areas of your life? Influences this Influences all situation 1 2 3 4 5 6 7situations 5. How important would this situation be if it happened to you? Not at all Extremely important1 2 3 4 5 6 7important
Quasi-Experimental Research • Definition: • Blends correlational and experimental approaches. Typically examines interaction between an individual difference variable and an experimental manipulation (expericorr example) • Disadvantages: similar to those of correlational research • 1 Third variable problem still remains • Advantages: similar to those of correlational research • 1 Can tease out cause and effect somewhat better if have manipulated variable
Quasi-experimental Example Discounting: Tendency to choose smaller, immediately available rewards over larger, delayed rewards Hypothetical Money Choice Task Choice is offered: smaller, immediately available reward or larger delayed one Chooses immediate reward, task is over and value is recorded Chooses delayed reward, new choice with larger immediate reward is offered Waiting for larger immediate reward before switching shows less discounting
HMCT (Version 1) You can have: $5 now or $100 in 1 week Which would you choose? $5 now $100 in 1 week
HMCT (Version 1) You can have: $10 now or $100 in 1 week Which would you choose? $10 now $100 in 1 week
HMCT (Version 1) You can have: $15 now or $100 in 1 week Which would you choose? $15 now $100 in 1 week and so on….
HMCT (Version 2) You can have: $5 now or $100 in 1 month Which would you choose? $5 now $100 in 1 month
HMCT (Version 2) You can have: $10 now or $100 in 1 month Which would you choose? $10 now $100 in 1 month
Hypothetical Results Effect of Condition: Version 1 $80.25 Version 2 $70.25 Interaction of Condition and SS: Version 1 $85.25 $65.00 Version 2 $65.25 $65.00 Low SS High SS
Quasi-Experimental Research • Definition: • Blends correlational and experimental approaches. Typically examines interaction between an individual difference variable and an experimental manipulation • Disadvantages: similar to those of correlational research • 1 Third variable problem still remains • Advantages: similar to those of correlational research • 1 Can tease out cause and effect somewhat better if have manipulated variable
Locus of Control Scale For each pair of statements, choose the one with which you most agree: 1a. Many of the unhappy things in people's lives are due partly to bad luck. 1b. People's misfortunes result from the mistakes they make. 2a. One of the major reasons we have wars is that people don't take enough interest in politics. 2b. There will always be wars, no matter how hard people try to prevent them. 3a. Sometimes I can't understand how teachers arrive at the grades they give. 3b. There is a direct connection between how hard I study and the grades I get. 4a. The average citizen can have an influence in government decisions. 4b. This world is run by the few people in power and there isn't much the little guy can do about it. Scoring: Give yourself one point for each of the following: 1a, 2b, 3a, 4b
Quasi-Experimental Research • Locus of Control • Beliefs about one’s ability to influence outcomes • Similar to learned helplessness • Assessed with LOC scale Selected participants to be high or low in external LOC • Randomly assigned participants to one of two conditions • Performance task with shock that is very easy to learn to avoid • Performance task with shock that is hard to learn to avoid • Findings in line with hypotheses • In easy task most people learned how to avoid shock • In harder task, Ps with high external LOC were less likely to learn
Problems to Look For Experimental confound: when another variable is allowed to vary with the independent variable. Third variable problem Nonrandom samples: when samples are selected so that not everyone has an equal opportunity to participate. Failure to replicate: single experiments do not constitute facts. Failure to include relevant comparison groups: lack an adequate baseline or normative data. (Example)
Failure to Include Comparison Make people happy or sad and examine effects on aggression: Sad Happy Aggression 7.5 3.0 The meaning depends on a control group: Sad Control Happy 1) 7.5 7.5 3.0 2) 7.5 5.0 3.0 3) 7.5 3.0 3.0