Correlational Research Strategy
Correlational Research Strategy. Goal . Examine and describe associations and relationships between variables No attempt at explanation No true IV; measurements taken on DV only No manipulation No control. Measurement on two variables. Identify patterns / consistency between two variables

Correlational Research Strategy
E N D
Presentation Transcript
Goal • Examine and describe associations and relationships between variables • No attempt at explanation • No true IV; measurements taken on DV only • No manipulation • No control
Measurement on two variables • Identify patterns / consistency between two variables • Trockel, Barnes, and Egget (200)- GPA and wake up time • Earlier wake up timehigher GPA
Data for Correlational Study • Represented using Scatterplot • Each individual represented by single point for X and Y scores • Benefit: quickly see the characteristics of the relationship between the two var
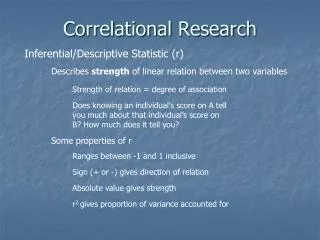
Measuring Relationships • Correlation coefficient • Direction of relationship • Form of relationship • Consistency or strength of relationship
Direction of Relationship • Two types • Positive: variables change in same direction • Negative: variables change in opposite direction
Form of Relationship • Linear-data points cluster around a “line” • Nonlinear or Curvlinear- nature of relationship changes at some point
Consistency or Strength • Takes on values between +1.00 and -1.00 • Closer the coefficient is to +-1.00 the stronger the relationship • A zero indicates no relationship
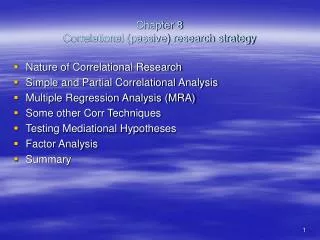
Coefficients • Pearson’s Correlation Coefficient • Scale data • Spearman’s Correlation Coefficient • Ranked data
Prediction • If significant correlation found then relationship can be used to predict Y scores based on some value of X variable • Regression Analysis
Strengths and Weaknesses • Used at embryonic stage of research • High external validity • Weak cause-and effect- explanation • Third-variable problem • Directionality problem • Springboard into experimental research