Download
1 / 38
380 likes | 480 Vues
Explore the need for government intervention in financial sectors and its impact on private bank lending during crises. Learn about trends in government bank ownership, lending strategies, and consequences of state interventions.

E N D
Direct state interventions in credit markets: When are they justified? César Calderón (FPDCE), Eva Gutiérrez (LCSPF), María Soledad MartínezPería (DECFP) and Carlos L. Vicente (FFSDR)
Roadmap • Motivation • Key messages • Government ownership of banks: trends • Bank ownership and lending during crises • Long-run impact of government bank ownership • Other types of state intervention • Conclusions
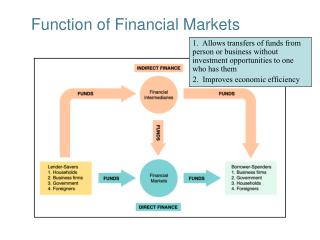
1. Motivation • Recent crisis reignited debate on need for direct government intervention in the financial sector. • Traditional tools: • Balance sheet expansion of government-owned banks. • Extension of government credit guarantees • Advanced countries: Unconventional macroeconomic policies • Merits of government intervention: • Countercyclical nature of public lending vs. potential long-run implications of government ownership.
2. Key messages • Government-owned banks (GOBs) used to help kick-start private bank lending. • Evidence during crisis is still far from conclusive. • Efforts to stabilize credit come at a cost: • Fiscal outlays to financial sector and rising public debt • Deterioration of loan quality and misallocation of resources • State devised strategies to prop up the financial sector without relying on GOBs • Balance sheet expansion by Central Banks: Easier to unwind but face hurdles in some EMs • Extension / renewal of credit guarantees • Credit guarantees • Limited evidence on financial and economic additionality. • Additionality brings along fiscal and economic costs • Design key to success of CGS • Needed: More rigorous assessments for most of these schemes.
3. Government ownership of banks Trends • Source: BRSS (The World Bank). Elaboration: GFDR Team.
3. Government ownership of banks Trends Source: Farazi, Feyen and Rocha (2010)
3. Government ownership of banks Trends • Source: BRSS (The World Bank). Elaboration: GFDR Team.
4. Bank ownership and lending during the crisis Why countercyclical action is needed? • Premise: Recovery of the corporate sector may require the recovery of the financial sector. • Are “Phoenix miracles” plausible? Background paper by Ayyagari, DemirgucKunt, and Maksimovic (2011) • Great deal of heterogeneity at the macro evidence –even when looking at Phoenix miracles identified at the aggregate level. • Microeconomic evidence greatly reduces the number of potential miracles identified at the macro level. • Evidence at the firm level suggests that recovery is not credit-less. • Firms substitute short-term credit with long-term external finance either through long-term borrowing or capital issuance. • Phoenix miracles are not supported by micro level data either in the U.S. or in emerging markets.
4. Bank ownership and lending during the crisis Real GDP downturns Real credit downturns • Note: The figures present the percentage of countries sharing the contractionary phase of the cycle of the corresponding variable. Elaboration: GFDR Team.
4. Bank ownership and lending during the crisis Growth dynamics around credit contractions (T) Growth dynamics around credit recoveries (T) • Note: The figures present YoY growth in real GDP around credit contractions and credit recoveries. Elaboration: GFDR Team.
4. Bank ownership and lending during the crisis Country-level evidence • Calderon (2011) examines whether the dynamic behavior of credit around recessions that coincide with financial crises are different in countries with high vis-à-vis low share of GOBs. • Sample: 66 Countries, 1980q1-2010q4 (quarterly data) • Identification of crisis-associated recessions: • Real output recessions: Turning point algorithms (Harding and Pagan, 2002a, b) • Financial crises: Laeven and Valencia (2008, 2010, 2011) • Questions • Are credit fluctuations sharper in crisis-associated recessions? • In crisis-associated recessions, are credit fluctuations more volatile in countries with high share of government-owned banks? • Is the drop in credit larger OR the recovery faster in countries with high share of government-owned banks? • If dynamic behavior of credit is different across countries with different shares of GOBs, does real output also depicts different behavior?
4. Bank ownership and lending during the crisis Country-level evidence • Quarterly information on credit and output for 66 countries for the period 1980-2010. • 21 industrial countries, 45 developing countries (mostly MICs) • Countries with high share of GOBs: If participation in top quartile of distribution. • Source of data: IFS, Haver Analytics, Datastream • Method (Beck, Levine and Levkov, 2010): Quarterly dynamics of credit around recessions that coincide with financial crises • Dcti is a binary variable equal to 1 for i=0 at start of crisis-related recession. It is equal to 1 for i<0 (>0) in the i-th period before (after) the crisis takes place. • coefficients exclude i=0 (start of recession). Dynamic behavior of credit expressed relative to the quarter where recession starts.
4. Bank ownership and lending during the crisis Country-level evidence Evolution around real output recessions (T) Countries with “low” GOB share Evolution around real output recessions (T) Countries with “high” GOB share • Note: T represents the peak in real GDP (start of the recession period). Elaboration: GFDR Team.
4. Bank ownership and lending during the crisis Country-level evidence Evolution around real output recoveries (T) Countries with “low” GOB share Evolution around real output recoveries (T) Countries with “high” GOB share • Note: T represents the trough in real GDP (start of the recovery period). Elaboration: GFDR Team.
4. Bank ownership and lending during the crisis Country-level evidence Real credit per capita around output recessions Countries with “low” GOB share Real credit per capita around output recessions Countries with “high” GOB share • Note: T represents the peak in real GDP (start of the recession period). Elaboration: GFDR Team.
4. Bank ownership and lending during the crisis Country-level evidence Real credit per capita around output recoveries Countries with “low” GOB share Real credit per capita around output recoveries Countries with “high” GOB share • Note: T represents the trough in real GDP (start of the recovery period). Elaboration: GFDR Team.
4. Bank ownership and lending patterns during the crisis Bank-level evidence from LAC and ECA • Bonin, Cull and Martinez Peria (2011) study how bank ownership affected credit growth in ECA and LAC before and during the 2008-2009 crisis. • Questions: • Did the crisis bring about a collapse in lending growth? • How did different types of loans react? • Was the impact of the crisis uniform across bank ownership types or did foreign bank lending fall more relative to domestic private and government-owned banks? • Did government-owned banks step up their lending during the crisis to mitigate the extent of the credit contraction?
4. Bank ownership and lending patterns during the crisis Bank-level evidence from LAC and ECA - Data • Bonin, Cull and Martinez-Peria (2011) data: Bank-level information for the period 2005-2009 for: • 8 countries in Central and Eastern Europe • Bulgaria, Croatia, Czech Republic, Hungary, Poland, Romania, Slovakia, and Slovenia. • 6 countries in Latin America • Argentina, Brazil, Chile, Colombia, Mexico and Peru. • Data comes from Bankscope and central bank webpages and includes: • Ownership information. • Total loan volumes and loan amounts by type of loan (corporate, consumer, and residential mortgages). • Balance sheet and income statement data on size, capitalization, liquidity, profitability, and funding structure.
4. Bank ownership and lending patterns during the crisis Bank-level evidence from LAC and ECA - Estimations Estimation strategy in Bonin, Cull and Martinez Peria (2011) ∆Li,t,j= Fgni,t,j+ Govti,t,j+ Crisisi,t,j+ Crisisi,t,jFgni,t,j+ (1) Crisisi,t,jGovti,t,j + Xi,t-1,j + j + ui,t,j i is the bank, t is the year, and j is the country. ∆Li,t,j is the growth of total gross loans (or of a certain loan category) for bank i at time t in country j. Fgn and Govt are dummies for foreign and government-owned banks, respectively. Crisis is a dummy which equals one during 2008 and 2009. Xi,t-1,j is a matrix of bank characteristics (such as size, capital, liquidity, profitability, funding) at t-1. j are country fixed effects.
4. Bank ownership and lending patterns during the crisis Bank-level evidence from LAC and ECA – Main findings • There are significant differences across ECA and LAC in the behavior of foreign and government-owned banks. • In ECA, foreign bank total loan growth fell more than domestic private bank credit growth during the crisis. • Foreign banks in LAC did not fuel loan growth prior to the crisis and did not contract their loans at a faster pace than domestic banks. • Government-owned bank lending growth in ECA did not differ from the behavior of domestic private bank credit. In general, government-owned banks in Eastern Europe did not mitigate the impact of the crisis on credit. • The opposite is true in LAC, where government-owned bank lending growth during the crisis exceeded domestic and foreign bank lending growth during this episode. • Overall, our results caution against sweeping generalizations about the behavior of foreign and government-owned banks during the crisis.
4. Case studies: Poland Behavior of a state-owned commercial bank Changes in total loans to enterprises and local government, 2008q3-2011q3 (QoQ %) NPLs for PKO BP, foreign banks, and the banking sector, 2008q3-2011q3 Source: Piatkowski, M., 2011. “PKO BP in Poland.” Washington, DC: The World Bank, ECSF2
4. Case studies: Brazil Mobilizing public savings through GOBs Raising public lending during crisis in Brazil BNDES: Increasing funding from the government Source: Central Bank of Brazil – Statistics. BNDES: RelatorioAnual.
4. Case Studies: Mexico Expansion of DBs’ balance sheet (still below 2006) • Mid-1990s: Restructuring of Mexican DBs to limit their leverage (e.g. the rural credit development bank was transformed into a trust fund) and to focus on support to the private sector through second tier operations. Currently 6 DBs. • DBs’ share in total banking sector assets and portfolio reduced substantially. • Balance sheets expanded in response to the global financial crisis. However, their loan portfolio share relative to the private banks remains smaller than what it was in 2006. • Liquid assets and portfolio investment grew much more than portfolio. While in June 2008 such assets amounted to 60% of net loan portfolio, by Nov. 2011 stood at 140 percent. Source: Gutierrez, E.M., 2012. “The Countercyclical role of Mexican Development Banks.” Washington, DC: The World Bank, LCSPF
4. Mexico: Counter-cyclical support to the private sector, increasingly through first tier operations and guarantees • Overall credit growth rates for DBs mirrored private sector growth rates. However, total credit experienced sharp deceleration –consumer credit, in particular. Credit to private sector grew mostly through first tier operations. • For the system as a whole the loan portfolio stabilized or began declining after December 2009. Lending by Banobras continued to grow until June 2010, reflecting credit difficulties in some municipalities. Bancomext has recently expanded credit, through special programs to strategic industries • DBs increased substantially their portfolio guarantee . (40 percent). Since then the balance has only decreased modestly (by about 10 percent). Guarantees granted by NAFIN have not declined even when many of the programs that provided access to working capital have expired. Source: Gutierrez, E.M., 2012. “The Countercyclical role of Mexican Development Banks.” Washington, DC: The World Bank, LCSPF
4. Mexico: Portfolio expansion has not compromised the financial position of the DBs. Fiscal Costs so far modest. • NPLs have remained at manageable levels (except for SHF) and are well provisioned for ---with ratios in excess of 200% (delinquency in guarantees not available). • Banks have maintained positive profitability. Banobras and Bancomext, who used to have negative profitability, turned around . • Capital adequacy ratios have remained sound (no lower than 14 percent for any bank). • Loans guaranteed by DBs are partially backed by counter-guarantee funds for up to 7 bill. pesos granted by various Ministries. Additional losses are covered by DBs. Such funds are replenished annually through budgetary appropriations. • Capital contributions were provided to the bank (sometimes through the capitalization of benefits) but in some cases capital declined due to operational losses. Overall capital contributions amounted to 9 bill. Pesos since the crisis (about US 700 mill). Source: Gutierrez, E.M., 2012. “The Countercyclical role of Mexican Development Banks.” Washington, DC: The World Bank, LCSPF
4. Bank ownership and lending patterns during the crisis Mexico: Conclusions • Overall, DBs activities have had a counter-cyclical role during the downturn but the portfolio of credit and guarantees is only decreasing very slowly. • However, Mexican banking sector development continued to lag with respect to peers. Great needs for infrastructure financing may also justify increased operations of Banobras, the DB that has extended its portfolio by most. Unclear what is the optimal size of DB given existing market failures. • Increased operations did not seem to have compromised the financial position of DBs. • Estimations of fiscal costs are still preliminary • Going forward maybe useful to target ranges for total DBs participation in the banking sector, establishing mechanisms that facilitate expansion and contraction of the balance sheet (and of capital in particular) to mitigate incentives to compete with the private sector (as opposed to complement its activities) during the upswing. Source: Gutierrez, E.M., 2012. “The Countercyclical role of Mexican Development Banks.” Washington, DC: The World Bank, LCSPF
4. Not all GOBs are alike! Survey on Development Financial Institutions (DFIs) • Survey on DFIs (de Luna Martinez and C. Vicente, 2011) • 90 DFIs from 61 countries responded to the Survey (combined US$ 2 trillion in assets and US$ 1.6 trillion in loan portfolio as of Dec. 2009) • 72 questions on: size, ownership, funding, business models, corporate governance, regulation and supervision, and challenges faced by DFIs • Ownership: 66 DFIs are fully owned by the government • Funding: 41% are deposit-taking DFIs, 89% can borrow from market, 40% receive govt. transfers, 60% enjoy government guarantees • Lending models: (i) First-tier only (36%), (ii) Second-tier only (12%), (iii) mixed (52%) • Countercyclicality: DFI’s loan portfolio grew 36% in 2007-9 as opposed to 10% increase in countries that responded the survey. • Asset quality: 55% of DFIs report NPL ratios below 5% in 2009 (no change from previous 3 years). Tier-II DFIs report even lower NPLs. • Corporate governance: Boards dominated by government officials. • Key Challenges: (a) Risk management, and (b) Self-sustainability.
4. Bank ownership and lending patterns during the crisis Summary of Findings • Evidence is far from conclusive on the performance of GOBs in propping up credit and acting counter-cyclically. • Government-owned banks appeared to have increased lending more than domestic banks during the crisis in LAC but not in ECA. • Case studies • Poland: • Evidence far from conclusive whether PKO BP prop up financial conditions beyond the rest of the banking system. • Brazil: • GOBs expanded balance sheets to mitigate credit crunch. • Fiscal space generated in Brazil key to fund GOBs • Mexico (E. Gutierrez) • DBs played countercyclical role (Tier-I operations and guarantees) but hard to unwind • DFIs (de Luna Martínez and Vicente) • Most of them are fully-owned by government, can borrow from markets, have mixed lending model • Boards dominated by government officials and face challenges in risk management and self-sustainability. • Still too early to sort out the costs in terms of efficient allocation of resources.
5. The long-run impact of government ownership Empirical evidence Source: GFDR Financial Benchmarking Database, BRSS (The World Bank). Elaboration: GFDR Team.
5. The long-run impact of government ownership Empirical evidence Industrial Countries Developing Countries Source: GFDR Financial Benchmarking Database, BRSS (The World Bank). Elaboration: GFDR Team.
5. The long-run impact of government ownership Empirical evidence • The bulk of the empirical evidence suggests that government bank ownership in developing countries has negative consequences for financial and economic development. It tends to be associated with: • Lower levels of financial development (Barth, Caprio, and Levine, 2001, 2004) . • More politically motivated lending (Dinc, 2005, Micco, Panizza and Yañez, 2007). • Lower banking sector outreach (Beck, Demirguc-Kunt, and Martinez Peria, 2007). • Wider intermediation spreads (La Porta et al. 2002). • Greater financial instability (Caprio and Martinez Peria, 2002). • Slower economic growth (La Porta, Lopez-de-Silanes, and Shleifer, 2002). • Detailed within-country studies that are less susceptible to endogeneity concerns and are better able to identify the impact of government ownership, provide evidence consistent with the bulk of the cross-country studies. • See Sapienza (2004) , Khwaja and Mian (2005 ), Cole (2009a,b), Carvalho (2010).
5. Government ownership of banks How to improve the effectiveness of GOBs? Policy issues • Activity and performance of many (but not all) GOBs plagued by problems of: • Political interference in credit decisions • Lack of managerial skills • There are some bright spots: Identify “good practices” in terms of institutional design (Scott, 2007; Rudolph, 2009; Gutierrez et al. 2011) • Clear and sustainable mandate • Target sector and complementarity with private sector • Adequate risk management systems to guarantee financially sustainable business • Funding from markets without explicit guarantee from government • Corporate governance • Transparent nomination of board members and selection of Senior management. • Ownership policy (e.g. Sweden). Principles associated with sound commercial practices, good corporate governance, competitive neutrality.
6. Other types of state intervention Expansion of central bank’s balance sheets United States United Kingdom • Sources: (1) Federal Reserve Bank - Factors affecting reserves balances (http://www.federalreserve.gov/releases/h41/hist/). • (2) Bank of England (Monetary financial institutions' balance sheets, income and expenditure)
6. Other types of state intervention • Monetary authorities in advanced countries acted as commercial banks. • Purchases of private sector securities to inject liquidity • Advantages of this type of intervention: • Easier to wind down • Smaller implementation lags • Can EMs actively implement them? • Setting up “open bank assistance” lines • Obstacles? • Legal constraints • Disadvantages of not having a reserve currency • Credibility issues due to high-inflation episodes • Need strong corporate governance to avoid political interference
6. Other types of state intervention Credit guarantee schemes (CGS) • Credit guarantees are risk transfer and diversification mechanisms. • Wide use of credit guarantees • Mitigate credit crunch • Provide access to under-served segments of the economy • Some evidence on financial additionality (increase in credit to previously rationed borrowers) • Canada (Riding et al. 2007), Chile (Larraín and Quiroz, 2006; Cowan et al. 2008), Japan (Uesugi et al. 2006; Wilcox and Yasuda, 2008), USA (Hancock, 2007) • More scant evidence on economic additionality(improvements in economic activity and employment) • Employment effects in US (Craig et al. 2007) and economic activity in Korea (Kang et al. 2008; Roper, 2009) • Additionality comes at a cost: • Sizeable displacement –e.g. Chile (Benavente et al. 2006) • Allocation of resources to riskier firms –e.g. Japan (Ono et al. 2011) • Allocation of resources to financially-unconstrained firms –e.g. Philippines (Saldana, 2000), Pakistan (Zia, 2008).
6. Other types of state intervention: Credit guarantee schemes (CGS) • Design of CGS as key to its success • Identification of good practices to guarantee scheme’s success (Green, 2003; Beck et al. 2010; Honohan, 2010). • Credit risk assessment practices outsourced to private sector. • Broad rather than very specific targeting (bureaucratic costs and misallocation of funding). • Set coverage ratios such that lenders properly monitor borrowers -60-70% (lender retains a significant part of the risk). • Pricing policy should guarantee the fund’s sustainability and ensure adequate participation. • Payout of the guarantee should be structured so as to reduce incentives of lenders to write-off loans after default. • Risk management practices should reduce own ex-post exposure to loan defaults (reinsurance, loan sales, portfolio securitization)
7. Concluding remarks • In an effort to stabilize aggregate credit and prop up financial conditions, the State has used: • Government owned banks • Other types of intervention (Central banks, GCS) On Government-owned banks: • Evidence far from conclusive on the performance of GOBs in mitigating large credit contractions. • Efforts to stabilize credit using GOBs may come at a cost (that still needs to be sorted out) • Lower quality of intermediation • Misallocation of resources On the expansion of balance sheets of the Central Bank • Rapid implementation and easier to unwind • Problems to implement in emerging markets • Credibility issues in countries that suffered high inflation • De Facto Central Bank independence
7. Concluding remarks On the use of credit guarantees • Some evidence of financial additionality • Additionality may come at a cost: Misallocation of funds • Literature still lacks rigorous assessments of these schemes. Identification of good practices to boost the performance of State • Government Owned Banks • Clear policy mandates • Adequate risk management systems to guarantee financial sustainability • Sound corporate governance practices • Ownership policy • Government Credit Guarantees • Outsourcing credit assessment practices • Risk management practices to reduce default exposure • Coverage ratios so that there is an incentive to monitor borrowers • Pricing policies that guarantee financial sustainability • Payout mechanisms that reduce incentives of lenders to write-off loans after default.