SlideServe
Menu
Préférences
© SlideServe · v2026

Graphing Data

castor-santiago avatar
7 diapositives · 270 Views · Nov 19, 2014

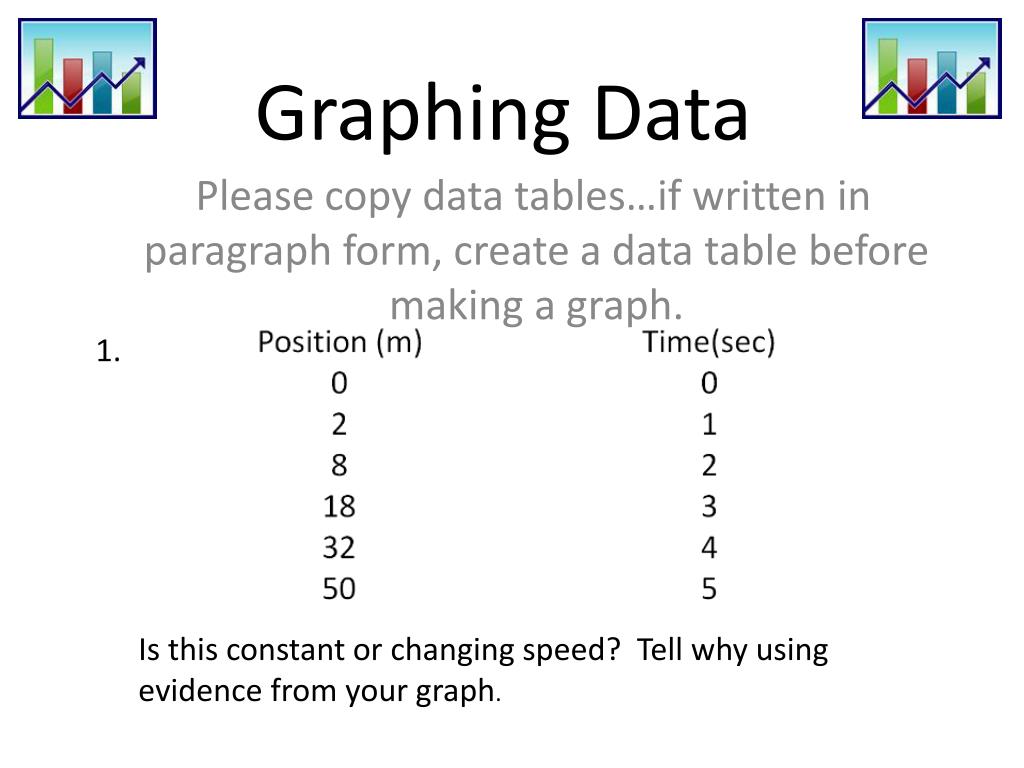
Graphing Data. 1. Please copy data tables…if written in paragraph form, create a data table before making a graph. Is this constant or changing speed? Tell why using evidence from your graph. Graphing Data. 1.
Graphing Data - slide 1
01 / 7Graphing Data
1 / 17

Télécharger la présentation

Graphing Data
Une image / un lien ci-dessous est fourni (tel quel) pour télécharger la présentation

Politique de téléchargement : le contenu du site vous est fourni TEL QUEL pour votre information et votre usage personnel ; il ne peut être vendu, concédé sous licence ni partagé sur d’autres sites sans l’accord de son auteur.Le contenu vous est fourni TEL QUEL, pour votre information et votre usage personnel uniquement. Téléchargez la présentation en cliquant sur ce lien. Lors du téléchargement, si vous ne parvenez pas à télécharger une présentation, l’éditeur a peut-être supprimé le fichier de son serveur.Pendant le téléchargement, si vous ne parvenez pas à obtenir une présentation, le fichier a peut-être été supprimé par l’éditeur.

F I N

Plus de contenu associé

Transcription de la présentation
  1. Graphing Data 1. Please copy data tables…if written in paragraph form, create a data table before making a graph. Is this constant or changing speed? Tell why using evidence from your graph.

  2. Graphing Data 1. Changing speed…. Speed is different at different points on the graph. Must come up with an average speed.

  3. Graphing Data Is this constant or changing speed? Tell why using evidence from your graph. Calculate the speed?

  4. Graphing Data Constant speed…Speed remains steady throughout at 10 m/sec. Did you get that????

  5. Graphing Data 3. MrEcklesis walking around the room as students take notes. He starts from his desk and walks 1m in 2 seconds to check on the first row of students. He then pauses for 2 seconds to call out Bennett for talking. Then he walks 4m more to the back of the class to take a note that Heather is writing. Right after, he quickly turns around at the 6 second mark and walks briskly back to the desk at the front to pick up his pen in 3 more seconds where he then signs Tyler’s admit slip.  Create a data table for this situation….Then create a line graph. Do you see steep slope? Flat slope? Explain what is happening.

  6. Graphing Data

  7. Practice Draw a simple line graph representing each of these situations... 1. object traveling fast 2. object traveling very slow 3. Object that made at least 1 pause in its journey and then continued on 4. Object was moving but then stopped for good. 5. Object traveling extremely fast infinitely