Download

1 / 42
450 likes | 603 Vues
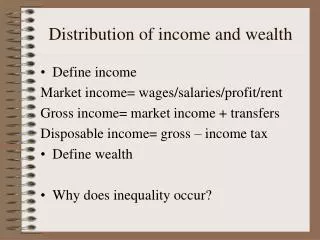
Survey nonresponse and the distribution of income. Emanuela Galasso* Development Research Group, World Bank * Based on joint work by Martin Ravallion, Anton Korinek and Johan Mistiaen. 1: Why are we concerned about non response? 2: Implications for measurement of poverty and inequality

E N D
Survey nonresponseand thedistribution of income Emanuela Galasso* Development Research Group, World Bank * Based on joint work by Martin Ravallion, Anton Korinek and Johan Mistiaen
1: Why are we concerned about non response? 2: Implications for measurement of poverty and inequality 3: Evidence for the US • Estimation methods • Results 4: An example for China
Types of nonresponse • Item-nonresponse • (participation to the survey but non-response on single questions) • Imputation methods using matching • Lillard et al. (1986); Little and Rubin (1987)
Types of nonresponse • Item-nonresponse • Imputation methods using matching • Lillard et al. (1986); Little and Rubin (1987) • The idea: • For sub-sample with complete data: • Then impute missing data using:
Types of nonresponse • Unit-nonresponse (“non-compliance”) • (non-participation to the survey altogether)
Unit-nonresponse: possible solutions Ex-ante: • Replace non respondents with similar households • Increase the sample size to compensate for it • Using call-backs, monetary incentives: • Van Praag et al. (1983), Alho (1990), Nijman and Verbeek (1992) Ex-post: Corrections by re-weighting the data • Use imputation techniques (hot-deck, cold-deck, warm-deck, etc.) to simulate the answers of nonrespondents
Unit-nonresponse: possible solutions Ex-ante: • Replace nonrespondents with similar households • Increase the sample size to compensate for it • Using call-backs, monetary incentives: • Van Praag et al. (1983), Alho (1990), Nijman and Verbeek (1992) Ex-post: Corrections by re-weighting the data • Use imputation techniques (hot-deck, cold-deck, warm-deck, etc.) to simulate the answers of nonrespondents • None of the above…
The best way to deal with unit-nonresponse is to prevent it Lohr, Sharon L. Sampling: Design & Analysis (1999)
Training Motivation Work Load Qualification Data collection method Interviewers Availability Type of survey Respondents Socio-economic Burden Economic Motivation Demographic Proxy TotalNonresponse Source: “Some factors affecting Non-Response.” by R. Platek. 1977. Survey Methodology. 3. 191-214
Rising concern about unit-nonresponse • High nonresponse rates of 10-30% are now common • LSMS: 0-26% nonresponse (Scott and Steele, 2002) • UK surveys: 15-30% • US: 10-20% • Concerns that the problem might be increasing
Nonresponse is a choice, so we need to understand behavior • Survey participation is a matter of choice • nobody is obliged to comply with the statistician’s randomized assignment • There is a perceived utility gain from compliance • the satisfaction of doing one’s civic duty • But there is a cost too • An income effect can be expected
Nonresponse bias in measuring poverty and inequality Compliance is unlikely to be random: • Rich people have: • higher opportunity cost of time • more to hide (tax reasons) • more likely to be away from home? • multiple earners • Poorest might also not comply: • alienated from society? • homeless
Implications for poverty • F(y) is the true income distribution, density f(y) • is the observed distribution, density • Note: and
Implications for poverty • F(y) is the true income distribution, density f(y) • is the observed distribution, density • Note: and Definition:correction factorw(y) such that:
Implications for poverty cont., If compliance falls with income then poverty is overestimated for all measures and poverty lines. i.e., first-order dominance: if w’(y) > 0 for all y (yP, yR), then for all y (yP, yR)
First-order dominance w’(y) > 0
Implications for inequality If compliance falls with income (w’(y) > 0) then the implications for inequality are ambiguous Lorenz curves intersect so some inequality measures will show higher inequality, some lower
Current Population Survey Source: CPS March supplement, 1998 – 2002, Census Bureau 3 types of “non-interviews:” • type A: individual refused to respond or could not be reached what we define as “non-response” • type B: housing unit vacant; type C: housing unit demolished we ignore type B/C in our analysis
Dependence of response rate on income Response rate and average per-capita income for 51 US states,CPS March supplement 2002
Dependence of response rate on income Response rate and average per-capita income for 51 US states, CPS March supplement 2002
Estimation method • In survey data, the income of non-responding households is by definition unobservable. • However, we can observe the survey compliance rates by geographical areas. • The observed characteristics of responding households, in conjunction with the observed compliance rates of the areas in which they live, allow one to estimate the household-specific probability of survey response. • Thus we can correct for selective compliance by re-weighting the survey data.
Estimation method cont., • {(Xij, mij)} … set of households in state js.t. mij households each carry characteristics Xij,where Xij includes e.g. ln(yij), a constant, etc. • total number of households in state j: Mj • representative sample Sj in state j with sampled households mj = mij • for each sampled household ε there’s a probability of response Dεij {0,1}
Estimation method cont., • The observed mass of respondents of group i in state/area j is • Then summing up for a given j yields: • Now let’s define: These are the individual weights This is known!
Estimation method cont., where obviously Then we can estimate
Estimation method cont., Optimal weighting matrix W = Var(()) … Hansen (1982) Assume for single state j: This can be estimated as Finally, where
Graph of specification 2: Probability of compliance as a function of income
Specifications with Other VariablesSpecifications 10 – 18, P = logit(q1 + q2 ln(y)+ q3 X1 + q4 X2):
Example for China • Urban Household Survey of NBS • Two stages in sampling • Stage 1: Large national random sample with very short questionnairre and high repsonse rate • Stage 2: Random sample drawn from Stage 1 sample, given very detailed survey, including daily diary, regular visits etc • Use Stage 1 data to model determinants of compliance • Then re-weight the data
Further reading • Korinek, Anton, Johan Mistiaen and Martin Ravallion, “An Econometric Method of Correcting for unit Nonresponse Bias in Surveys,” Journal of Econometrics, (2007), 136: 213-235 • Korinek, Anton, Johan Mistiaen and Martin Ravallion, “Survey Nonresponse and the Distribution of Income.” Journal of Economic Inequality, (2006), 4:33-55