Income Distribution
250 likes | 593 Vues
Income Distribution. Gene Chang U of Toledo. Income Distribution. The size distribution of income shows the amount of income received by rich, poor, and middle-class individuals or families and often is interpreted as a direct measure of welfare. Determined by…

Income Distribution
E N D
Presentation Transcript
Income Distribution Gene Chang U of Toledo
Income Distribution • The size distribution of income shows the amount of income received by rich, poor, and middle-class individuals or families and often is interpreted as a direct measure of welfare. • Determined by… • The number of people under the poverty line • The inequality in income distribution
Income Distribution Popular measures: Lorenz curve GINI coefficient Number of people living below $1 a day (PPP) Number of people living below $1 a day (PPP)
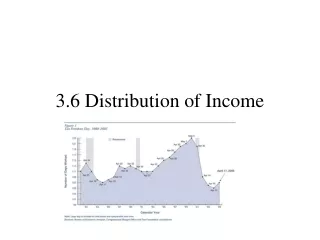
Lorenz Curve • To draw a Lorenz curve, income recipients are arrayed from lowest to highest income along the horizontal axis. • The curve itself shows the share of total income received by an cumulative percentage of recipients. • Its shape indicates the degree of inequality in the income distribution. • By definition, the curve must touch the 45 degree line at both the lower-left corner (0% of recipients must receive 0% of income) and the upper-right corner (100% of recipients must receive 100% of income).
Lorenz Curve • If everyone had the same income, the Lorenz curve would lie along the 45 degree line (perfect equality). • Equality means simply that everyone gets the same income (or owns the same wealth). • If 1% of the population receives 100% of income and the rest of the population receives nothing, then the Lorenz curve is a right angel one. • Inequality is greater the farther the Lorenz curve bends away from the 45 degree line.
Lorenz curve % of income received % of income received 100% 100% 0% 0% 0% 100% 0% 100% Percentage of Income Recipients Percentage of Income Recipients
Lorenz curve • When comparing two or more countries the following terminology can be used: • “Lorenz Dominates” – One country’s Lorenz curve is above another country’s at every point. • “Lorenz Incompatible” – Occurs when one country’s Lorenz curve intersects another country’s curve.
Lorenz curve 100% 38.5% 19.8% 9.2% 3% 0% 20% 40% 60% 80% 100%
GINI Coefficient • Derived from the Lorenz curve. • The ratio is understood most easily as the value of area A divided by area A + B. • Gini Coefficient = A / (A + B) = A / triangular area • A + B = . 5 so A = .5 – B • Gini = (.5 – B) / .5 • Thus, the larger the share of the area between the 45o line and the Lorenz curve, the higher is the value of the Gini concentration ratio.
Lorenz curve A B
GINI coefficient for the Brazilian data set • A + B = (1/2) (100% ) = 50% • B = (1/2) (0 + .03) (.2) + (1/2) (.03 + .092) (.2) + (1/2) (.092 + .198) (.2) + (1/2) (.198 + .385) (.2) + (1/2) (.385 + 1) (.2) = .1 * (.03 * 2) + (.092 * 2) + (.198 * 2) + (.385 * 2) + 1 = .1 * 2.43 = .243 • GINI = (.5 – B) / .5 = (.5 - .243) / .5 = .514
Problems • Lorenz curves can intersect. • It is even possible for curves with different shapes to generate the same Gini coefficient. • This happens when one distribution is very unequal in one part of its range, while another is unequal in a different part.
International comparison • GINI < 30 Good • GINI > 50 Bad
International comparison • http://hdrstats.undp.org/indicators/147.html • http://en.wikipedia.org/wiki/List_of_countries_by_income_equality
Inequality and health • http://www.globalissues.org/article/4/poverty-around-the-world#InequalityandHealth
International Comparison • European welfare states • Formal centrally planned system • Transitional economies • East Asian countries • Fast growth economies, China and India • Latin American countries • African countries
Reasons for the income inequality accross countries • Resources coming more from endowment of land and privilege • System and government policy: progressive tax system and transfer payment • Economic growth
Kuznets inverted U curve • Kuznets curve is the graphical representation of Simon Kuznets's theory that economic inequality increases before decreases during the economic growth of a country • In the primitive agrarian economy, most people living at the subsistence level, so the majority is equally poor. • In early stages of development, when investment in physical capital is the main mechanism of economic growth, inequality encourages growth by allocating resources towards those who save and invest the most.
Kuznets inverted U curve • In mature economies human capital accrual, or an estimate of cost that has been incurred but not yet paid, takes the place of physical capital accrual as the main source of growth, and inequality slows growth by lowering education standards because poor people lack finance for their education in imperfect credit markets. • Also, in a mature economy, there are better universal education and health care system, and more progressive tax system, so the income distribution becomes more equal
Income distribution in CPEs • It is said that the income distribution in CPEs are very equal. • In general, the Gini coefficients in those countries are below 0.30. • The reasons are • All assets are owned by the state so individuals do not receive income from private ownership of assets • Most people are employed by the state and difference between salary scales are very limited among employees. • Generous transfer payments to households
Income distribution in CPEs • But one should not overlook the inequality in CPEs: • Non-monetary income received by the privileged class • Regional gaps and urban-rural income gap