Understanding Global Income Inequality and Undernutrition: A Focus on the Poorest Populations
210 likes | 344 Vues
This analysis explores the stark disparities in income distribution and their impact on undernutrition, focusing on the poorest populations in the world. It highlights the dire conditions faced by those living in third-world countries, often landless and in menial jobs, with shocking income differences exemplified by the Democratic Republic of Congo and Switzerland. The text discusses the Gini coefficient as a measure of wealth inequity, child labor prevalence, and the paradox of hunger in wealthier nations. Understanding these issues is vital for addressing global food insecurity.

Understanding Global Income Inequality and Undernutrition: A Focus on the Poorest Populations
E N D
Presentation Transcript
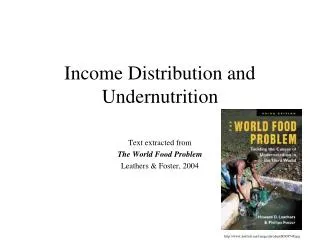
Income Distribution and Undernutrition Text extracted from The World Food Problem Leathers & Foster, 2004 ttp://www.amazon.com/World-Food-Problem-Toward-Undernutrition/dp/1588266389
Poorest of the Poor • Live in third world • Mostly landless • Work for others, menial jobs • Poorly educated • Illiterate • Superstitious • Squatters who live in huts • Almost no food • Fragmented household • Debt to relatives or lenders http://archives.zinester.com/60514/143124/232308_slum.JPG
Per capita incomes differ • Democratic Republic Congo: $80/yr • Switzerland: $38,330 • Average person in Switzerland makes 500X more than in Mozambique. • If compute purchasing power parity, difference between richest and poorest countries is 80X http://faculty.washington.edu/wgold/family%20on%20crinnenhorn.jpg http://news.bbc.co.uk/media/images/38542000/jpg/_38542715_family300bbc.jpg
Purchasing Power Parity 2003 http://en.wikipedia.org/wiki/File:PPP2003.svg
Human Development Index • Measures quality of life • High HDI • High income countries • Low HDI • Low income countries • HDI not perfectly correlated with income http://bp0.blogger.com/_vxI-ox6Dacw/R0yJQ0c_8YI/AAAAAAAAAO4/jCG1CPQfBb0/s1600-h/HDI+map.JPG
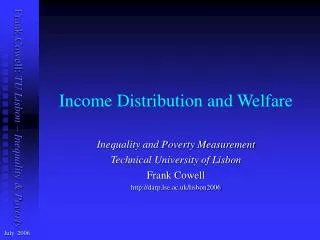
Gini Coefficient • Gini coefficient: • Based on area of crescent made by Lorenz curve • measures inequity of wealth • = A/A+B • Gini index = Gini coefficient x 100 • Lowest inequity is in Japan • Gini coefficient = .249 • Gini index = 24.9 • Richest 20% controls 35% of income • Highest inequity is in Brazil • Gini index= 60.7 • Richest 20% controls 64% of income
Global Gini Coefficients http://upload.wikimedia.org/wikipedia/commons/thumb/a/aa/Gini_Coefficient_World_Human_Development_Report_2007-2008.png/800px-Gini_Coefficient_World_Human_Development_Report_2007-2008.png
Kuznets Curve • As a country develops, rich must get richer first • Therefore inequity will increase initially • Later, inequity will drop as prosperity increases Data from 75 countries
Wealthy out-compete poor for food • Can outbid poor for food • Also purchase more livestock • Herd becomes more dependent on grain • Price of grain is bid up • Harder for the poor to buy grain
Overall inequity declining slowly • Global Gini coefficients: • .67 in 1980 • .65 in 1990 • .63 in 2000 • .62 in 2005 (Bob Sutcliff, 2007) http://www.bbc.co.uk/radio4/today/gallery/media/poverty2.jpg
Child Labor • 250 million children work worldwide • 22% of workforce in Asia • 17% of workforce in Latin America • 1/3 of children in sub-Saharan Africa • Jobs • Agriculture • Textiles • Maids and services • Construction and manufacturing • Prostitution • Many sold into debt bondage • To pay parent’s debt or as collateral • Advance on wages http://uzbekistan.neweurasia.net/wp-content/images/june-2007/01_02a.jpg
U.S. Poor are Wealthy • Poverty income • $9,359/yr • Person at poverty line in U.S. • has higher income than 80% of people in the world • 97% poor households in U.S. have color TV
Middle Class Decline • Middle class is disappearing in U.S. • Income gap is increasing between wealthy and poor.
U.S. Inequity increasing • Gini coefficients: • 1968: 38.6: • 1970: 39.4 • 1980: 40.3 • 1990: 42.2 • 2000: 46.2 • 2007: 47.0 http://www.visualizingeconomics.com/wp-content/uploads/us_income_inequal_5_15_2006.jpg
Rich in U.S. getting richer http://online.wsj.com/public/resources/images/P1-AL265_COMPAR_20080420183003.gif
Hunger in the U.S.A. • 36.3 million people live in households that experience hunger • or the risk of hunger • Includes 13 million children • More than one in ten households in the United States (11.2 percent). • 1/5 of U.S. food ends up in the landfill • Source: Bread for the World Institute (2004) http://www.endhunger.org/images/u_s_hunger.png
http://www.bendib.com/newones/2006/november/large/End%20of%20Hunger%20in%20US.jpghttp://www.bendib.com/newones/2006/november/large/End%20of%20Hunger%20in%20US.jpg