Poverty and Undernutrition
480 likes | 739 Vues
Chapter 8. Poverty and Undernutrition. Preview. What is poverty? Measuring poverty Empirical facts on poverty Functional impact of poverty. Conceptual Issues. Poverty Line

Poverty and Undernutrition
E N D
Presentation Transcript
Chapter 8 Poverty and Undernutrition
Preview • What is poverty? • Measuring poverty • Empirical facts on poverty • Functional impact of poverty
Conceptual Issues • Poverty Line • A critical threshold of income, consumption, or access to goods and services below which individuals are declared to be poor. • A minimum level of “acceptable” economic participation in a society • Consumption or Nutrition-based poverty line • Minimum nutrient levels for an adequate diet (price of food or consumption of calories) • Cost of shelter (rent) and clothing • Income-based poverty line • Legally declared minimum wage • Arbitrary threshold: say, 60% of mean income in a society
Problems with Measuring Poverty • Overall expenditure versus item-by-item consumption • Should we compare the characteristics of a consumption basket with a benchmark basket? • Or, should we compare consumption expenditures with a minimum threshold? • Nutrition levels may not rise with income (demand for canned foods or fast foods) • Income simply represents the capacity to consume, not consumption itself • However, income or expenditure-based poverty lines are easier to use, given constraints imposed by available data
Problems with Measuring Poverty • Absolute versus Relative Poverty • What is an “acceptable level of participation in a society?” • Owning a TV may be deemed socially necessary in one country, but not another • Similar examples can be motivated for cars, higher education, leisure, etc • Constituents of a poverty line may vary widely across countries, making comparisons difficult • Poverty should be evaluated relative to prevailing socio-economic standards in a society
Problems with Measuring Poverty • Temporary or Chronic Poverty? • We must be careful to distinguish between “structural” or “chronic” poverty and “temporary” poverty • Unanticipated shocks can push people temporarily below the poverty line (natural disasters, disease, poor rainfall, etc) • Policies to deal with temporary poverty can be very different from those required for chronic poverty
Problems with Measuring Poverty • Households or Individuals? • Available expenditure data is often at the household level • Should we divide total household consumption expenditures by number of individuals in the household? • This gives an idea of average or “per-capita” expenses • Problems: • Allocation of expenditures within the household are skewed • Discrimination against females and elderly (gender and age bias) • Large households typically have more children, who consume less than adults • Fixed costs of setting up or running a household
Do We Really Need a Poverty Line? • Poverty lines are always an approximation to a very “fuzzy” threshold • Sustained deprivation can be insidious: effects are often felt at a later point of time • However, the poverty line gives us a starting point to study poverty
Measures of Poverty • Some notation: • y denotes income or expenditure • Subscripts i, j,…, refer to individuals • p denotes the poverty line, converted to a common currency • For nutrition-based poverty lines, p represents the money required to attain the minimum calorie threshold • the mean income in the economy is m
Headcount and Headcount Ratio • Headcount (HC): number of people below the poverty line, i.e., number of individuals i such that • Headcount Ratio (HCR): gives an idea of the relative incidence of the poor where n is the size of the population
Problems with the HC and HCR • Fails to capture the extent to which income falls below the poverty line • People near the poverty line are less poor than those far below it • Can lead to problematic policy decisions: • Policies are systematically biased in favor of individuals very close to the poverty line, because they offer the biggest bang for the buck (politically)
Poverty Gap Ratio (PGR) • The PGR is a measure of the average shortfall of income from the poverty line • How much extra income or consumption, on average, is required to get ALL poor people to the poverty line? • Division by mean income: an idea of how large the poverty gap is relative to the resources that must be used to close the gap
Income Gap Ratio (IGR) • One problem with the PGR: • In societies with high inequality (where average income is high), the PGR looks very small even though there may be a lot of poverty • An alternative : • Income shortfall is divided by the total income required to bring all poor people to the poverty line
Demographic Features of the Poor • Size of households below the poverty line typically tend to be larger than the average family size for the economy • Number of children per family is highly correlated with poverty • Burden of poverty falls disproportionately on the young • Affects childhood nutrition and education: long-term consequences for the economy • Women are disproportionately represented as heads of poor households • Absence of a principal male earner is closely related to poverty • This trend is widespread in Africa, Latin America, and South and East Asia
Rural and Urban Poverty • Poverty in rural areas is significantly higher than that in urban areas (even after adjusting for cost of living) • Poverty is highly correlated with the lack of ownership of productive assets • Lack of assets leads to poverty • Poverty leads to the sale of assets • Poverty and small-scale agriculture are strongly correlated • Bulk of the poor are either landless or near landless
Urban Poverty • Most poor reside in the “informal” sector • Mix of self-employment and low-wage labor • Self employment: Vendors, petty traders, tea-stall owners, beggars, shoe-shine boys, garbage-sifters, load carriers, rickshaw pullers, roadside hawkers, etc. • Wage Labor: often seasonal or casual, not subject to minimum wage laws • Low levels of human capital • High levels of illiteracy • Lack of access to credit to acquire human capital
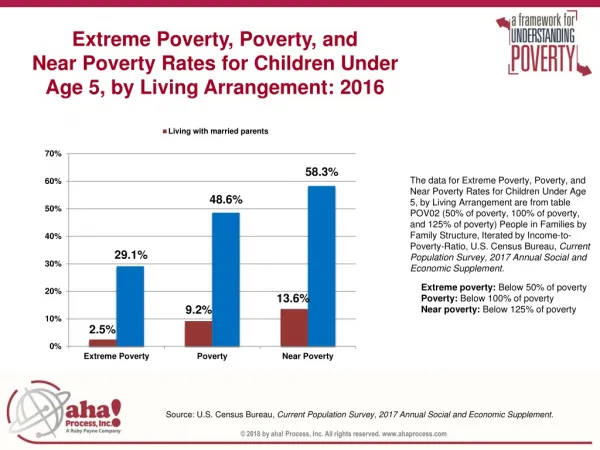
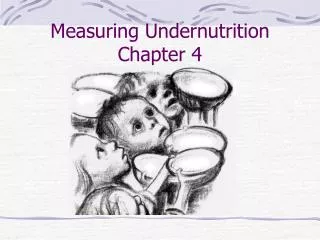
Nutrition • Poverty and undernutrition are closely correlated, especially among children • Muscle wastage, stunting, illness & infection • Low cognitive skills and capacity to do productive work in adults • One issue: increases in income may or may not have a significant impact on nutrition • Direct nutrition supplements may have a greater impact than an increase in income
Income and Nutrition • Why is the relationship between income and nutrition ambiguous? • Good nourishment is desirable, because of health and productivity benefits • By contrast, individuals may have preferences for • foods that taste good (meat) • foods that are well advertised (fast foods) • foods that are indicators of social and economic attainment (canned food, expensive varieties) • These types of food may have little nutritional value Nutritional elasticity: What is the percentage change in the consumption of calories when household budgets change by one percentage point?
The Functional Impact of Poverty • Poverty affects the access that poor people have to markets • Credit • Labor • Education • Land (for cultivation) • Lack of access to these markets can have fundamental consequences for an economy
Credit • The poor have little or no access to credit markets • Lack of collateral that can be put up for loan repayment • In societies where labor mobility is low, one form of informal collateral is labor • Can lead to permanent indebtedness • The poor have limited incentives to repay loans
Insurance • Why do people insure? • What is needed for successful insurance? • Incident against which insurance is sought must be • Verifiable • Must not be subject to Moral Hazard • This is why “perfect insurance” is never available • Example: deductibles, contingencies, etc.
Insurance • Formal insurance markets often don’t exist in developing countries because of problems with verifiability and moral hazard • Example: think of crop failure: • What is the exact degree of crop failure? • Was it due to bad weather or lack of hard work?
Insurance • However, moral hazard problems are actually small for the poor • Opportunity cost of labor for the poor is low • Poor are unemployed or underemployed to begin with, so cost of time is low • This permits them to credibly supply more effort • Therefore, where formal insurance is not available, informal schemes of insurance can work (example: shared labor or resources)
Nutrition and Labor Markets • A very large proportion of the poor around the world are also significantly below adequate standards of nutrition • Effects of undernutrition: • Muscle wastage, retardation, vulnerability to illness & infection • Lower work capacity • Psychological effects: metal apathy, depression, lower intellectual capacity, lack of motivation • Low life expectancy
Energy Balance • Energy Input: periodic consumption of food • Nutrition meets economics: • Access to food = access to income • For poor, access to income = returns to labor supply (poor don’t have much capital assets) • Resting Metabolism: energy required to • Maintain body temperature • Sustain heart and respiratory action • Supply minimum energy requirements of “resting tissues”
Energy Balance • How much energy is required for adequate “resting metabolism”? • FAO’s “reference man” • European male with a weight of 65 kg (143 lbs) • Energy requirement: 1700 Kcal per day • Energy Required for Work: • FAO’s “reference man” requires 400 Kcal per day for “moderate activity.” • For the poor who have to work hard in the fields all day, this is a very conservative estimate
Energy Balance • Some estimates of energy requirements: • West African agriculture: • 213 kcal per hour for carrying a 20 kg log • 372 kcal per hour for bush clearing • 502 kcal per hour for felling a tree • “The FAO’s reference man, a European male weighing 65 kg, therefore spends most of his day rather ambiguously defined, but apparently not working very hard.”
Energy Balance • Storage and Borrowing • Over the short/medium term, energy deficits/surpluses can be absorbed/cushioned by the human body • A sustained, long-term deficit in the body’s energy requirements can have disastrous consequences • Illness • Incapacitating debility • death
Labor Markets and Capacity to Work • Labor markets create income and access to nutrition and good health • Good nutrition, in turn, affects the capacity of the body to perform tasks that generate income • This circular argument points to the existence of “poverty traps” in developing countries
Nutrition and Work Capacity • Low nutrition is capable of creating low incomes reduces possibilities for good nutrition in the future • This leads to a “vicious cycle” of poverty • Several questions can be raised in this regard: • Why is the vicious cycle of low nutrition-low income not possible for the poor in rich countries? • Can’t people simply borrow their way out of the vicious cycle? • If work capacity affects future work output, why don’t employers take advantage of this and offer long-term contracts? • If long-term contracts indeed exist for other reasons, then does this affect nutritional status?
Why does the vicious cycle of poverty not exist for rich countries? • In rich countries, labor markets are tight • Low supply relative to demand • Attractive opportunities in other markets • Labor markets in rich countries are very diversified • In tight labor markets, the returns to labor are, on average, quite high, even for people with low work capacity • Example: hourly income for barbers or janitors • This breaks the vicious cycle, as high wages permit adequate nutrition (even for the poor in rich countries)
Why can’t people simply borrow their way out of the vicious cycle? • Poor simply do not have access to credit markets • There may not be a way to improve nutrition for the poor without redistribution of income from the rich • We have seen before that redistributing wealth can be both economically and politically contentious
If work capacity affects future output, why don’t employers offer long-term contracts? • It is unlikely that an employer would offer a long-term contract, just to extract future gains from work capacity • There is no guarantee that the employee will keep working for a given employer (he/she may choose to work for another employer, or might migrate to another village) • If an employer makes a nutrition-enhancing investment, the market may bid up the wage for the employee employee will reap the entire benefits of the employer’s investment!
If long-term contracts existed for other reasons, can this affect nutritional status? • When nutrition is used by the employer to build up work capacity of the employee, there must be separate set of factors that sustains this contract • Slave economy • Slaves were a valuable commodity, due to intense competition for their services in the labor market • Slave diets on plantations in the US South exceeded that for all non-indentured labor in the 19th century
If long-term contracts existed for other reasons, can this affect nutritional status? • Industry • Positive relationship between nutrition and productivity • Feeding low-paid workers well forces them to consume a greater proportion of their wages as food • Domestic Servants • Servants are associated with characteristics acquired on the job that make them costly to replace • “The quality of food given to domestic servants..is..greatly superior to that obtainable by members of working-class families from which servants are drawn.” (Booth, 1903)
Poverty and the HouseholdThe Unequal Sharing of Poverty • In poor households, if scarce resources are equally allocated, then per-capita resources are very small • This may limit total household work capacity • This fact can cause an unequal sharing of poverty within the household • Systematic discrimination against some members of the household • “Lifeboat ethic”
Poverty and the HouseholdThe Unequal Sharing of Poverty • What types of household members are discriminated against? • Females (both adults and children) • Old and infirm • Social institutions often form perceptions about future earning capacities • Female children are seen as a financial burden, where the institution of dowry exists • Household work of adult females may be non-monetized and hence not internalized • Wage-earning females who earn less than males • Medical expenses for the old and infirm who have no future earning potential