Measuring Undernutrition Chapter 4
Measuring Undernutrition Chapter 4. From Chapter 3 What we Learned. Biggest problem, Over- & under-nutrition Total Calories Protein Micronutrients . Common methods of assessing undernutrition. Clinical Assessment : Looking for physical signs of nutritional disorders
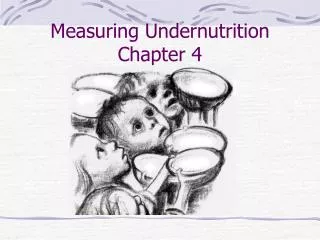

Measuring Undernutrition Chapter 4
E N D
Presentation Transcript
From Chapter 3What we Learned • Biggest problem, Over- & under-nutrition • Total Calories • Protein • Micronutrients
Common methods of assessing undernutrition • Clinical Assessment: Looking for physical signs of nutritional disorders • Biochemical: Examine blood and urine looking for metabolic changes that accompany nutritional disorders
Common methods of assessing undernutrition (cont.) • Dietary Assessment: Track what the person eats • Anthropometric Assessment: Measuring the human body and its parts. It is the most common method of assessing nutritional disorders
Clinical Assessment • Look at: • Hair color (lighter and thinner) • Ankle swelling • Enlarged necks • Poor eye sight
Clinical Assessment (cont.) • What is each an indicator of? • Hair color (Lighter and thinner) • Protein deficiency • Ankle swelling • Protein deficiency causing circulation problems • Enlarged necks • Goiter, iodine deficiency • Poor eye sight • Vitamin A deficiency
Clinical Assessment (cont.) • Be aware that other things can cause these symptoms • When these symptoms show to this extent then the problem is advanced • Used to analyze: • most severe cases • Specific types of malnutrition
Biochemical Assessment • Blood and urine tests • Show micronutrient deficiencies • Accurate but relatively expensive
Dietary Assessment • 2 Methods: • Survey – recall by the person, after-the-fact • Review dietary records
Dietary Assessment (cont.) • Problems with both methods • People can’t recall exactly • People lie • People adjust their eating habits when they are in a study • Breast feeding – difficult to determine how much the baby eats • Seasonal variations (price & availability)
Dietary Assessment • Useful in: • Doing comparisons of diet and income • Also useful to track food allocations within the family
Anthropometric Assessment • Most commonly-used method • Size – indicator of calories & protein intake
Anthropometric (cont.) • Acute undernutrition • Short-term inadequate food • Caused by famine or war • People can recover • Chronic undernutrition • Long-term inadequate food • Even moderate, effects are permanent
Stunting • Def.: low height-for-age • Shows that the person has experienced chronic undernutrition during growth years • It is a symptom of pastundernutrition
Stunting (cont.) • People born in 1910 were 4 cm (1.6 in) shorter than those born in 1930 • People born in 1950 1 cm (1/2 in) taller than those in 1930 • What does that tell you?
Wasting • Def.: low weight for height • This is a symptom of currentundernutrition
Under weight • Def.: low weight for age • A symptom of presentundernutrition
What about Inheritance? • Part of people’s height is determined by their genes • Are there ethnic differences? • These factors are less important than other factors • Nature vs. nurture
Other Factors • Poverty • Poor food intake • Infectious & parasitic diseases • Other environmental factors
Use of Antropometry • Most useful in comparisons of infants • Older children, less so • In developed countries useful in measuring overnutrition of adults
Antropometry (cont.) • What is measured? • Height • Weight • Arm circumference • One of the better measures of fat in the body • Skin-fold thickness
Antropometry (cont.) • Measurements are easy and cheap • Need: • Scale • Tape measure • Calipers (know what they are)
Antropometry (cont.) • Training someone to recognize undernutrition by clinical means takes a lot more time • Comparisons to a Reference Group • “You are shorter than average” • “You weigh less than average”
What is the purpose of all this? • Identify those in need of help • Either those who are undernourished • Or Those who are overnourished
Method 1Measuring Large Groups (Note: Method 1 is not labeled, but is described in the paragraph on p. 51 Drawing Inferences from a sample) • A continent? • A country? • A region? • Among demographic groups • Def: characteristics of a population or segment of the pop. • Among ethnic groups
Measuring (cont.) • Cannot measure everyone • Statistics – Sampling • If our sample is representative then inferences can be made of the whole population
Method 2Examine Aggregate Data • Look at data on: • Birth weight • Infant mortality • Morbidity • Def.: the rate of incidence of a disease • These are not direct measures of nutritional status
Method 3 Aggregate Nutrient Intake • Or: average nutrient intake • FAO keeps such data on each country • FAO Food and Agriculture Organization • Part of the UN • These food-balance sheets show sources and types of food – over 100 different foods
Aggregate (cont.) • FAO keeps stats on sources of food: • Beginning stocks • Production • Imports
Aggregate (cont.) • FAO keeps stats on uses of food: • Ending stocks • Export • Animal feed • Consumption
Aggregate (cont.) • They use the word balance sheet because sources and use are in balance
Aggregate data: These measures imply undernutrition in a region • High IMR • Low birth-weights • High morbidity (illness) rates
Look at food availability to infer the existence of undernutrition Food balance sheets estimate human consumption 1. Add up the supply of a specific food beginning stocks + production + imports
2. Subtract the amount used for: exports + livestock feed + seed + ending stocks What about food stocks used for fuel? What is left can be assumed to go for human consumption
3. Convert this to calories • do for all foods, to calculate available calories per capita per day (a widely used measure of malnutrition) • Remember: Carbohydrate and protein has 4 calories/gram & Fats and oils have 9 calories/gram
This is a mean, it could be that some people are consuming above the average and some people are undernourished a. Studies of individuals need to be done to infer the percentage of the population that have inadequate food intake
IV. Undernutrition & child health A. Undernourished mothers are likely to produce malnourished babies 1. Low birth weight 2. 40 times more likely to die before their first year
B. Undernutrition leads to high under-five mortality rates Worldwide average (1999) = 78 per 1,000 live births • Industrialized countries = 7 Developing countries = 85 • Least developed countries = 161 (Sub-Saharan Africa)
C. Undernutrition results in a weakened immune system which leads to death from childhood diseases Infant mortality rate (IMR; children who die before their 1st birthday per 1,000 live births) goes up as a child’s percent of the median weight-for-age goes down
IMR in the U.S. is 2.1% – before five = 2.5% IMR in Guinea = 21.6% – before five = 36.7%
V. Effects of undernutrition A. Mental development impaired in undernourished children B. Educational achievement lowered
C. Childhood undernutrition results in smaller adults who can do less physical work & who earn less money
D. Undernourished adults are less productive when working and lose more work time to sickness and so have less money to buy food (note the cycle)
Measuring nutritional status for large groups A. Draw inferences from a sample using statistics 1. Use info from a subset of the population to infer characteristics of the whole population 2. Sample must be representative
B. Use aggregate data on the effects of undernutrition to infer how much undernutrition exists Aggregate data: data compiled from several measurements