Download
1 / 15
150 likes | 284 Vues
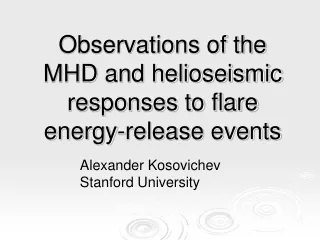
Flare energy release and wave dynamics in nearby sunspot. Marian Karlick ý Astronomical Institute, Fričova 278, 251 65 Ondřejov, Czech Republic Robert Sych and Larisa Kashapova Institute of Solar-Terrestrial Physics, Irkutsk, Russia Jaroslav D udík

E N D
Flare energy release and wave dynamics in nearby sunspot Marian Karlický Astronomical Institute, Fričova 278, 251 65 Ondřejov, Czech Republic Robert Sych and Larisa Kashapova Institute of Solar-Terrestrial Physics, Irkutsk, Russia Jaroslav Dudík Centre for Mathematical Sciences, University of Cambridge, Cambridge CB3 OWA, UK Solar and Stellar Flares, Observations, simulations and synergies June 23 - 27, 2013, Prague, Czech Republic
Contents • Dynamics of the 3-min waves in sunspot • a) Relation between sunspot waves and burst activity • b) Temporal dynamics and spatial structure of the 3-min waves • propagating upwards from the sunspot • c) Modes of the 3-min wave activity • 2. The 07 June 2012 flare and wave processes in nearby sunspot • a) Flat shape SRX emission in decay phase of the flare • b) Wave dynamics above the sunspot in EUV and radio • c) Magnetic field connectivity of the sunspot and flare site • 3. Conclusions
Relation between sunspot wave and burst activity Sych, R.; Nakariakov, V. M.; Karlicky, M.; Anfinogentov, S.Astronomy and Astrophysics, 505, 2, 2009 Combined image of AR 10756 taken with NoRH at 17 GHz and in the optical bandwith TRACE on 2005 May 01 at 03:14:39 UT. An example of the flaring activity on 2005 May 1: the correlation time profile of NoRHat 17 GHz.
The temporal dynamics of the 3-min waves propagation on coronal level above sunspot Sunspot TRACE May 04, 2005 Original 3D Cube Data Amplitude Dynamics Power Dynamics Sych, R. A. at all., Solar Physics, 266, 2, 2010
The spatial structure of 3-min radio and EUV sources during the “quiet” and “disturbed” modes Temporal variation of narrowband radio sources Temporal variation of narrowband EUV sources Sych, R. A. at all., Solar Physics, 266, 2, 2010
The ‘burst’ mode of the 3-min wave activity Sych, R.; Nakariakov, V. M.; Karlicky, M.; Anfinogentov, S. Astronomy and Astrophysics, 505, 2, 2009
EUV, X-ray and optical observation of the C1.5 solar flare in June 07, 2012 Left: Temporal evolution of electron temperature (TE) and emission measure (EM) from the RHESSI spectra and EUV 131Å flux (AIA/SDO). Right: Temporal profiles of EUV emission (SDO/AIA), X-ray and microwave emission (NoRH, 17 GHz). The Callisto BLEN radio spectrum observed in June 7, 2012.
The oscillations in footpoint of the burst loop before the flare Left panel: The EUV image of the magnetic loop footpoint (sunspot) (SDO/AIA, 171A). Right panel: The narrowbandimage centered at 5.6 mHz frequency oscillations. Bottom panel: The global wavelet spectrum (GWS) of oscillations. The narrowband EUV images (SDO/AIA, 171A) of power oscillation in sunspot. The period bandwidth is 8.3 mHz – 2.87 mHz. The images was obtained before the main pulse in 04:20 – 05:50 UT.
Sunspot waves as a trigger of flare activity The movie of the “quiet” wave propagation with 5.6 mHz frequency at 171A (SDO/AIA). The dotted contours shows the sunspot in optics. Top panel: The NoRH correlation profile in intensity (R+L) channel at 17 GHz. Middle panel: The power oscillation profile centered at 5.6 mHz frequency. The dotted line shows the trend of increasing 3-min oscillations before the radio burst. Bottom panel: The amplitude oscillations with 3-min period (left) and their power wavelet spectrum (right).
2D temporal dynamics of the radio sources on June 07, 2012 The time evolution of the microwave burst (NoRH, 17 GHz) coincided with June 07, 2002 flare. The snapshots for 05:53:20, 05:54:50, 05:58:50 and 06:10:20 UT is presented. The solid lines is intensity, dotted line is polarization. The background is EUV image at 171A. The movie of the microwave burst at 17 GHz, overlapped on EUV image at 1700A (SDO/AIA). The solid lines is intensity, dotted line is polarization.
Time-distance plot and 3-min waveguides during the June 07, 2012 flare at 171A and 94A ‘Quiet’ stage ‘Burst’ stage max Left panels: The time-distance plot of wave propagation at 171A 94A (SDO) and radio (NoRH). Right panel: Thecoronal waveguides (5.6 mHz) at 171A and magnetic waveguides from SDO/HMI magnetogram.
EUV images of flare loops on June 07, 2012 An evolution of the flare loops in 171 Å and 94 Å lines before and at the beginning of the June 7, 2012 at four times: (05:46:22 UT, 05:48:00 UT, 05:51:36 UT, and 05:54:21 UT). The arrows show the loop connecting the flaring loops and nearby sunspot (channel). The arrow 1 shows the hot flare loop under the channel, the arrow 2 shows twisted flaring loops. The 171 and 94 Å loops (the arrows) formed at 06:10:36 UT, at location, where strongly twisted loops were found before the are.
A mechanisms for the modulation of the flaring emission by an external MHD wave: • The scenario proposed by Nakariakov et al. (2006): • Energy of transverse (kink or sausage) oscillations of coronal loops can periodically leak to • a magnetic neutral point or line situated nearby. The incoming fast magnetoacoustic wave • refracts towards the neutral point, experiencing focussing and steepening. This • periodically generates very sharp spikes of electric current density in the vicinity of the • neutral point. The instabilities can cause the onset of micro-turbulence and hence enhance • the plasma resistivity several orders of magnitude. This would lead to periodic triggering • of magnetic reconnection and manifestation of the loop oscillations as periodic variation of • the flaring light curve. • The scenario proposed by Zaitsev & Stepanov (1989): • The centrifugalforce associated with the • periodiclongitudinal field-alignedwave • motionscan cause periodic transverse kink- • like perturbationsof the magnetic • structures A scenario of the June 7, 2012 flare based on the models of Zaitsev & Stepanov (1989) and Nakariakov et al. (2006) . A) Scenario at the beginning of the flare, and B) at the end of the flare.
Results • The3-min narrowband PWF maps of the active regionextended V- and arrow-shapedsources situated over sunspot the arms extended towards the flare site; • These arms the magnetic plasma channels linkthe sunspot and the flare siteas waveguides. • The energy of 3-min oscillations leaks out thesunspots in the form of field-aligned slow magnetoacousticwaves(e.g. De Moortel 2006). • The power of the oscillation is variable max just before the burst as a flare precursor. • The curvature of the magnetic field lines and the centrifugalforce associated with the periodic longitudinal field-alignedwave motions cause periodic transverse kink-like perturbationsof the magnetic structures (e.g. Zaitsev & Stepanov 1989) and reconnections. • We suppose that the transverse waves, propagating along the magnetic loop, are a trigger of flare processes in twisted loops located below this magnetic loop. • The wave energy, coming from sunspot to flare site the energy release can be kept up by additional triggering of reconnection or by suppressing of plasma thermal conductivity origination of flat-shape emission during the flare.
Thank you for your attention !