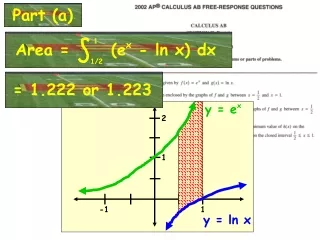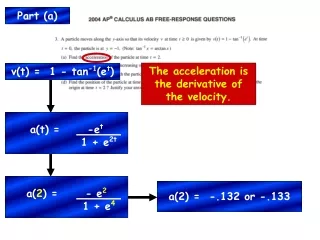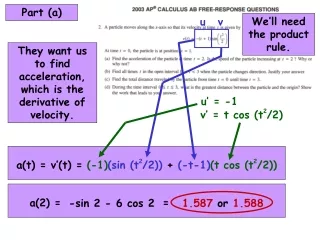
Part (a)
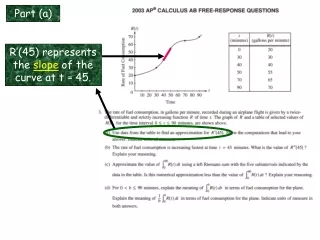
Part (a). R’(45) represents the slope of the curve at t = 45. 55 - 40. m =. 50 - 40. The slope of the pink line can be calculated by Algebra 1 methods. m = 3/2. R’(45) = 1.5 gal/min 2. Part (b). R”(45) = 0. There are a couple ways to explain why.

Part (a)
E N D
Presentation Transcript
Part (a) R’(45) represents the slope of the curve at t =45.
55 - 40 m= 50 - 40 The slope of the pink line can be calculated by Algebra 1 methods. m= 3/2 R’(45) = 1.5 gal/min2
Part (b) R”(45) = 0 There are a couple ways to explain why...
R(t) represents the rate of fuel consumption. R’(t) tells how quickly this fuel consumption is increasing or decreasing. Since the problem tells us that “…the rate of fuel consumption is increasing fastest at time t = 45 minutes”, they are actually telling us that the first derivative has a MAX there. Whenever the first derivative attains a MAX or a MIN, the second derivative must be equal to ZERO at that point. Thus, R”(45) = 0.
Concave down Concave up A more visual way to explain why R”(45) = 0 is that the graph of R(t) has a point of inflection there. LOOK... When a point of inflection occurs, the second derivative must be ZERO there.
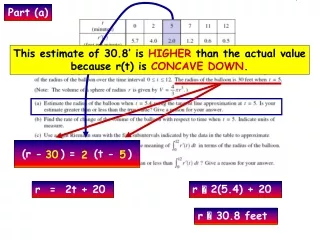
Approximate integral = + + + + (30)(20) (10)(30) (10)(40) (20)(55) (20)(65) Part (c) = 3700 This approximation is LESS than the actual integral because we used a LEFT Riemann sum (inscribed rectangles). The approximation error can be seen in the drawing. It’s the sum of all the white regions below the curve, but above the rectangles.
represents the total amount of fuel consumed by the plane (in gallons) during the first “b” minutes of flight. b b R(t) dt R(t) dt 0 0 total amount of fuel consumed represents the average rate of fuel consumption for the first “b” minutes (in gallons/min.) 1 b average rate of fuel consumption Part (d)