Download
1 / 25
270 likes | 692 Vues
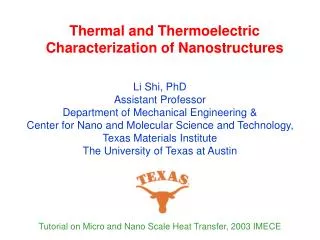
Thermal and Thermoelectric Characterization of Nanostructures. Li Shi, PhD Assistant Professor Department of Mechanical Engineering & Center for Nano and Molecular Science and Technology, Texas Materials Institute The University of Texas at Austin

E N D
Thermal and Thermoelectric Characterization of Nanostructures Li Shi, PhD Assistant Professor Department of Mechanical Engineering & Center for Nano and Molecular Science and Technology, Texas Materials Institute The University of Texas at Austin Tutorial on Micro and Nano Scale Heat Transfer, 2003 IMECE
Outline • Scanning Thermal Microscopy of Nanoelectronics • Thermoelectric Measurements of Nanostructures
Silicon Nanoelectronics • Heat dissipation influences speed and reliability • Device scaling is limited by power dissipation IBM Silicon-On-Insulator (SOI) Technology
Carbon Nanoelectronics TubeFET (McEuen et al., Berkeley) Nanotube Logic (Avouris et al., IBM) • Current density: 109 A/cm2 • Ballistic charge transport V -
Thermometry of Nanoelectronics Techniques Spatial Resolution Infrared Thermometry 1-10 mm* Laser Surface Reflectance 1 mm* Raman Spectroscopy 1 mm* Liquid Crystals 1 mm* Near-Field Optical Thermometry < 100 nm Scanning Thermal Microscopy (SThM) < 100 nm *Diffraction limit for far-field optics
Thermal Topographic Z T X X Scanning Thermal Microscopy Atomic Force Microscope (AFM) + Thermal Probe Laser Deflection Sensing Cantilever Temperature sensor Sample X-Y-Z Actuator
10 mm Microfabricated Thermal Probes Pt Line Tip Pt-Cr Junction Laser Reflector SiNx Cantilever Cr Line Shi, Kwon, Miner, Majumdar, J. MicroElectroMechanical Sys., 10, p. 370 (2001)
Thermal Imaging of Nanotubes Thermal 30 10 10 20 5 5 Height (nm) Height (nm) 30 nm 30 nm 10 0 0 0 -400 -200 0 200 400 -400 -400 -200 -200 0 0 200 200 400 400 Distance (nm) Distance (nm) Multiwall Carbon Nanotube Topography Topography 3 V m 88 A m m 1 1 m m Spatial Resolution V) m 50 nm Thermal signal ( Distance (nm) Shi, Plyosunov, Bachtold, McEuen, Majumdar, Appl. Phys. Lett., 77, p. 4295 (2000)
Low bias: Ballistic High bias: Dissipative (optical phonon emission) Metallic Single Wall Nanotube Topographic Thermal DTtip A B C D 2 K 0 1 mm
Polymer-coated Nanotubes Topography Thermal After coating Before coating -2 V, 4.4 mA 2 V, 7.8 mA 1 mm GND GND • Asymmetric heating at the two contacts The polymer melted at a ~3V bias
Future Challenge: Temperature Mapping of Nanotransistors SOI Devices SiGe Devices • Low thermal conductivities of SiO2 and SiGe • Interface thermal resistance • Short (10-100 nm) channel effects (ballistic transport, quantum transport) • Phonon “bottle neck” (optical-acoustic phonon decay length > channel length) • Few thermal measurements are available to verify simulation results
Thermal Transport in Nanostructures Carbon Nanotubes Hot Cold p • Long mean free path l • Strong SP2 bonding: high sound velocity v • high thermal conductivity:k = Cvl/3~ 6000 W/m-K • Below 30 K, thermal conductance 4G0 = ( 4 x 10-12T) W/m-K, linear T dependence (G0 :Quantum of thermal conductance) Heat capacity
Semiconductor Nanowires Nano-patterned Si Nanotransistor (Berkeley Device group) VLS-grown Si Nanowires (P. Yang, Berkeley) Gate Drain Source Nanowire Channel Hot Spots • Increased phonon-boundary scattering • Modified phonon dispersion • Suppressed thermal conductivity • Ref: Chen and Shakouri, J. Heat Transfer 124, 242 Hot p Cold
Efficient Peltier Cooling using Nanowires Bi Nanowires Thermoelectric figure of merit: Low k high COP Dresselhaus et al., Phys. Rev. B. 62, 4610
Q I Thermal Measurements of Nanostructures Suspended SiNx membrane Long SiNx beams Pt resistance thermometer Kim, Shi, Majumdar, McEuen,Phys. Rev. Lett. 87, 215502 Shi, Li, Yu, Jang, Kim, Yao, Kim, Majumdar, J. Heat Tran 125, 881
Pipet Nanostructure suspension Spin • Direct CVD growth • Dielectrophoretic trapping Sample Preparation • Wet deposition Chip SnO2 nanobelt Nanotube bundle Individual Nanotube
Thermal Conductance Measurement T - 1 - 1 - 1 G T G G h s b b T T 0 0 Q 2QL Q h
Size -- Thickness: 1 nm uncertainty in tapping mode AFM d/d = 10 % for d = 10 nm d/d = 50 % for d = 2 nm (individual SWCN) Raman Spectroscopy Measurement Errors and Uncertainties • Contact Resistance ~ d ~ d 2 -- G-1Sample /G-1Contact decreases with d, and is estimated to larger than 10 for measurements reported here
Carbon Nanotubes CVD SWCN • An individual nanotube has a high k~ 2000-11000 W/m-K at 300 K • The diameter and chirality of a CN may be probed using Raman spectroscopy • k of a CN bundleis reduced by thermal resistance at tube-tube junctions
SnO2 Nanobelts Phonon scattering rate: 64 nm 64 nm 53 nm 39 nm Umklapp Boundary Impurity Collaboration: N. Mingo, NASA Ames tU-1 = tU,bulk-1 ti-1 = ti,bulk-1 tb-1 = v/FL v: phonon group velocity FL: effective thickness 53 nm 53 nm, ti-1 =10t-1i, bulk Circles: Measurements Lines: Simulation using a Full Dispersion Transmission Function approach • Phonon-boundary scattering is the primary effect determining the suppressed thermal conductivities Shi, Hao, Yu, Mingo, Kong, Wang, submitted
Si Nanowires Symbols: Measurements Lines: Simulation using a modified Callaway method • Phonon-boundary scattering is the primary effect determining the suppressed thermal conductivities except for the 22 nm sample, where boundary scattering alone can not account for the measurement results. Li, Wu, Kim, Shi, Yang, Majumdar, Appl. Phys. Lett. 83, 2934 (2003)
Th Seebeck Coefficient S = VTE / (Th –Ts) I • Oxygen doped • Quasilinear (metallic) behavior • Phonon drag effect at low T Ts VTE
Future Challenge:Nanomanufacturing of Nanowire Arrays as Efficient Peltier Devices • Nano- imprint Pattering of Thermoelectric Nanowire Arrays 10 nm Cr nanowire array 40 nm Cr nanowire array • Test-bed Peltier devices for cooling IR sensors
Summary • Scanning Thermal Microscopy of Nanoelectronics: • -- Thermal imaging with 50 nm spatial resolution • Thermoelectric (k, s, S) Measurements of Nanostructures Using a Microfabricated Device: • -- Super-high k of nanotubes • -- Suppressed k of nanowires
Acknowledgment Students: Choongho Yu; Jianhua Zhou; Qing Hao; Rehan Farooqi; Sanjoy Saha; Anastassios Marvrokefalos; Anthony Hayes; Carlos Vallalobos Collaborations: UC Berkeley: Arun Majumdar; Deyu Li (now at Vanderbilt); Philip Kim (now at Columbia); Paul McEuen (now at Cornell); Adrian Bachtold (now at Paris); Sergei Plyosunov UT Austin: C. K. Ken Shih & Ho-Ki Lyeo; Zhen Yao; Brian Korgel GaTech: Z. L. Wang NASA: Natalio Mingo UCSC: Ali Shakouri MIT: Rajeev Ram & Kevin Pipe Support: NSF CTS (CAREER; Instrumentation)