Download
1 / 1
10 likes | 198 Vues
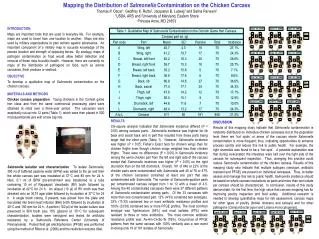
June 19, 2006. Jan. 28, 2008. April 20, 2008. July 17, 2006. Feb. 14, 2008. June 3, 2008. Feb. 28, 2008. July 31, 2006. July 31, 2006. B. B. B. B. B. B. B. B. B. A. A. A. A. A. A. A. A. A. Pos. Pos. Pos. G. G. G. G. G. G. G. G. G. C. C. D. D. C. D. C.

E N D
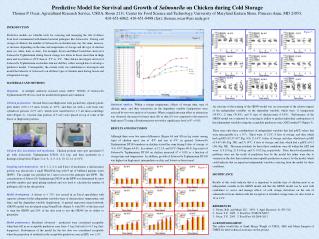
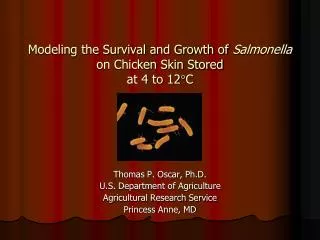
June 19, 2006 Jan. 28, 2008 April 20, 2008 July 17, 2006 Feb. 14, 2008 June 3, 2008 Feb. 28, 2008 July 31, 2006 July 31, 2006 B B B B B B B B B A A A A A A A A A Pos. Pos. Pos. G G G G G G G G G C C D D C D C C D D C D C C C D D D Neg. Neg. Neg. E E E F F E E F E F F E E E F F F F H H H H H H H H H I I J J I I I J J J I I I I J J J J K K L L K L K K L L K K K K L L L L B A G C D March 5, 2008 Sept. 18, 2006 July 14, 2008 Sept. 25, 2006 April 9, 2008 Oct. 16, 2006 April 2, 2008 Sept. 20, 2008 E F H I J B B B B B B B B A A A A A A A A G G G G G G G G C C D D C D C C D D C D C C D D K L E E E F F E E F E F F E E F F F H H H H H H H H I I J J I I I J J J I I I J J J K K L L K L K K L L K K K L L L Mapping the Distribution of Salmonella Contamination on the Chicken Carcass Thomas P. Oscar1, Geoffrey K. Rutto2, Jacquelyn B. Ludwig1 and Salina Parveen2 1USDA, ARS and 2University of Maryland, Eastern Shore Princess Anne, MD 21853 INTRODUCTION Maps are important tools that are used in everyday life. For example, maps are used to travel from one location to another. Maps are also used by military organizations to plan actions against adversaries. An important component of a military map is accurate knowledge of the precise location and strength of opposing forces. By analogy, maps of pathogen contamination on food would allow better detection and removal of these risks to public health. However, there are currently no maps of the distribution of pathogens on food, such as animal carcasses, fresh produce or seafood. OBJECTIVE To develop a qualitative map of Salmonella contamination on the chicken carcass. MATERIALS AND METHODS Chicken carcass preparation. Young chickens in the Cornish game hen class and from the same commercial processing plant were obtained at retail over a three-year period. The carcasses were aseptically cut-up into 12 parts (Table 1), which were then placed in 500 ml polycarbonate jars with screw cap lids. Salmonella isolation and characterization. To isolate Salmonella, 300 ml of buffered peptone water (BPW) was added to the jar and then the whole carcass part was incubated at 37C and 80 rpm for 24 h. Next, 0.1 ml of BPW pre-enrichment was transferred to a tube containing 10 ml of Rappaport Vassiliadis (RV) broth followed by incubation at 42C for 24 h. An aliquot (10 μl) of RV broth was then streaked onto an XLT4 agar plate followed by incubation at 37C for 24 h. A single black colony, if present, was picked from the plate and inoculated into brain heart infusion (BHI) broth followed by incubation at 40C and 150 rpm for 24 h. A portion (100 μl) of the isolate culture was preserved in BHI broth plus 15% glycerol at -70C for subsequent characterization. Isolates were serotyped and tested for antibiotic resistance by a Salmonella Reference Center (University of Pennsylvania). Pulsed field gel electrophoresis (PFGE) was performed using the method of Ribot et al. (2006) and the restriction enzyme XbaI. RESULTS Chi-square analysis indicated that Salmonella incidence differed (P < 0.05) among carcass parts. Salmonella incidence was highest for rib back and sacral back and in part this resulted from these parts being larger that the other parts (Table 1). However, Salmonella incidence was higher (P < 0.05; Fisher’s Exact test) for chicken wings than for chicken thighs even though chicken wings weighed less than chicken thighs. There were no differences (P > 0.05) in Salmonella incidence among the same chicken part from the left and right side of the carcass except that Salmonella incidence was higher (P < 0.05) on the right drumstick than on the left drumstick. Overall, 181 of 840 or 22% of the chicken parts were contaminated with Salmonella and 40 of 70 or 57% of the chicken carcasses contained at least one part that was contaminated with Salmonella. The number of Salmonella-positive parts per contaminated carcass ranged from 1 to 12 with a mean of 4.5. Among the 40 contaminated carcasses there were 37 different patterns of Salmonella contamination among parts. Of the 33 carcasses with more than one contaminated part, 12% (4/33) contained two serotypes, 33% (11/33) contained two or more antibiotic resistance profiles and 100% (33/33) contained two or more PFGE profiles. The most common serotype was Typhimurium (94%) and most isolates (97%) were resistant to three or more antibiotics. The most common antibiotic resistance profile was: Ax-Am-Ce-Su-Te (76%). Occurrence of PFGE patterns from the same carcass with 100% similarity was a rare event involving only 19 of 181 isolates of Salmonella. DISCUSSION Results of this mapping study indicate that Salmonella contamination is randomly distributed on individual chicken carcasses but at the population level there are ‘hot spots’ or areas of the carcass where Salmonella contamination is more frequent; thus, indicating opportunities to enhance process control and reduce this risk to public health. For example, the right drumstick was found to be a ‘hot spot’. A possible explanation was that during evisceration the intestines were laid over the right side of the carcass for subsequent inspection. Thus, changing this practice could reduce Salmonella contamination of the chicken carcass. Results of this mapping study also indicate that multiple subtypes (serotype, antibiotic resistant and PFGE) are present on individual carcasses. Thus, to better assess and manage this risk to public health, Salmonella incidence should be based on whole carcass incubations as parts and more than one isolate per carcass should be characterized. In conclusion, results of this study demonstrate, for the first time, the high value that carcass mapping has for improving poultry inspection and food safety. Additional research is needed to develop quantitative maps for risk assessment, carcass maps for other types of poultry (broiler chickens and turkeys) and for other pathogens (Campylobacter jejuni and Listeria monocytogenes).