Download

1 / 52
530 likes | 814 Vues
Explore the valuable role of CT and MRI in detecting and managing prostate cancer. Learn how multiparametric MR imaging techniques are changing the landscape of prostate cancer diagnosis and treatment.

E N D
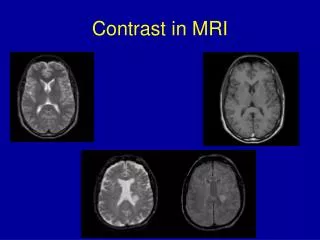
July 2015 Advances in MRI in Urology
Imaging of Urinary Tract: Role of CT & MRI • Computed tomography (CT) & magnetic resonance imaging (MRI): increasingly valuable tools for assessing urinary tract • Use of CT & MRI should therefore be tailored to patient & clinical question Hiorns MP. PediatrNephrol. 2011; 26: 59–68.
Advantages & disadvantages: CT & MRI Hiorns MP. PediatrNephrol. 2011; 26: 59–68.
Normal prostate from apex to base in 54-year-old male (axial plane). (a) Axial T2WI at the level of the apex. (b) At the midgland level, the densely packed central/transition zones are surrounded by high signal intensity peripheral zone tissue. Bhavsar A, et al. BioMed Research International. Volume 2014, Article ID 728539, 9 pages.
(c) Base level. The prostatic base is generally composed of almost entirely central zone/transition zone (CZ/TZ); however, a large amount of peripheral zone. Bhavsar A, et al. BioMed Research International. Volume 2014, Article ID 728539, 9 pages.
MR Imaging of Prostate • MRI prostate is playing an increasing role in detection, staging & localization of prostate cancer • Multiparametric MR: • Accepted standard for prostate imaging • Consists: T2-weighted imaging in combination with other functional techniques: diffusion-weighted imaging, dynamic contrast-enhanced MR imaging, or MR spectroscopic imaging Yacoub JH, et al. RadiolClin N Am 52 (2014) 811–837.
MR Imaging of Prostate • A systematic approach in reporting prostate MR imaging constitutes identifying abnormal regions & grading each region on degree of suspicion for cancer based on its features on multiparametric sequences • Central gland tumors are more challenging & are approached differently than more common peripheral zone lesions • Emerging & potential indications of prostate MR imaging include tumor localization, guiding biopsy, guiding focal therapy, assessing aggressiveness, selecting and monitoring patients for active surveillance & post-treatment follow-up Yacoub JH, et al. RadiolClin N Am 52 (2014) 811–837.
Normal high T2 signal of peripheral zone. Axial (A), coronal (B) & sagittal (C) T2 turbo spin echo (TSE) images show intrinsic high T2 signal of peripheral zone (PZ). Central gland (CG) shows heterogeneous appearance with low-signal nodular areas representing BPH resulting in mild enlargement of the CG & overall size of prostate. Thin layer of low T2 signal surrounding prostate is known as capsule (short arrow). In anteriormost aspect of gland there is thickened band of low T2 signal (white arrowhead) known as anterior fibromuscular stroma. Neurovascular bundle is noted posterolateral to peripheral zone (long arrows) Yacoub JH, et al. RadiolClin N Am 52 (2014) 811–837.
Central zone of prostate: Central zone is defined anatomically as region of prostate surrounding ejaculatory ducts from prostatic base to verumontanum. Axial (A) & coronal (B) T2 TSE images show central zone to have homogeneous low signal intensity (outlined on images on right) with symmetric appearance on either side of midline Yacoub JH, et al. RadiolClin N Am 52 (2014) 811–837.
Advances in MRI: How They Are Changing Management of Prostate Cancer • Individually, functional MRI techniques (MRSI, DWI & DCE-MRI) have shown the potential to add value to conventional anatomic MRI in PCa detection Patient (age: 56 yr) with PSA level of 11 ng/ml; no suspicious findings at DRE. Histology at transrectal ultrasound-guided biopsy showed prostate adenocarcinoma (PCa), Gleason score 7 (3 + 4) in left-side samples; histology at radical retropubic prostatectomy showed Gleason score 7 (4 + 3) PCa with extracapsular extension (ECE) in left peripheral zone (PZ) indicating stage pT3a. (A) Axial T2-weighted magnetic resonance (MR) image shows low signal intensity lesion in left PZ (outlined in white), which is suggestive of PCa with ECE (arrow) Sciarra A, et al. European Urology. 2011; 59: 962-977.
Advances in MRI: How They Are Changing Management of Prostate Cancer (B) MR spectroscopic imaging (MRSI) of tumour (blue box in [a]): high citrate (Ci), high choline (Ch) + creatine (Cr). (C) MRSI of normal prostate area in right PZ (yellow box in [a]): high Ci, low Ch plus Cr. (D) Axial dynamic contrast-enhanced MR image showing leakage of contrast medium both in tumour (white circle) in the left PZ & in some BPH areas (arrows) Sciarra A, et al. European Urology. 2011; 59: 962-977.
Advances in MRI: How They Are Changing Management of Prostate Cancer (E) Axial apparent diffusion coefficient map from diffusion-weighted imaging shows restriction (ie, low signal intensity) (T) in left PZ, which may be suggestive of area of Gleason grade 4 PCa Sciarra A, et al. European Urology. 2011; 59: 962-977.
Advances in MRI: How They Are Changing Management of Prostate Cancer Initial diagnosis & determination of need for prostate biopsy • MRI technology: continuously evolving • More extensive use of MRI technology in clinical trials & practice will help to improve PCa diagnosis & treatment planning • Great interest has been shown in multiparametric MRI, which combines anatomic T2-weighted (T2W) imaging with MR spectroscopic imaging (MRSI), dynamic contrast-enhanced MRI (DCE-MRI) & diffusion-weighted imaging (DWI) Sciarra A, et al. European Urology. 2011; 59: 962-977.
Advances in MRI: How They Are Changing Management of Prostate Cancer Biopsy strategy Sciarra A, et al. European Urology. 2011; 59: 962-977.
Biopsy scheme of entire gland volume. Note potential biopsy sites based on MRI morphologic, metabolic & vascularisation changes in medial & lateral left peripheral zone (planes IV, V, VI; gland area between 4 and 5). Sciarra A, et al. European Urology. 2011; 59: 962-977.
multiparametric MRI (mpMRI) • Over the years, multiparametric magnetic resonance imaging (mpMRI) has emerged as a key tool in PCa management • Many different clinical questions regarding active surveillance, detection, localization, staging, assessment of aggressiveness & recurrence of disease have or can be answered through a combination of MRI sequences, including T2-weighted imaging, diffusion-weighted imaging, dynamic contrast-enhanced imaging, and MR spectroscopic imaging Scheenen TWJ, et al. Investigative Radiology. March 2015.
Flow of patients in current prostate cancer management, indicating possible uses of mpMRI for answering spectrum of clinical questions Scheenen TWJ, et al. Investigative Radiology. March 2015.
mpMRI, Different Techniques T2-Weighted Imaging • T2-weighted MRI has served as primary sequence for visualizing internal structures in & around gland • Conventionally, this is performed using multislice multishot fast spin echo 2-dimensional (2D) MRI sequence in which 20 to 30 slices are obtained with high in-plane spatial resolution at echo time of 100 milliseconds (ms) • Whereas anatomic information provided by T2-weighted imaging is useful for local staging of PCa, nonspecificity of T2 signal abnormalities within prostate has limited role of this sequence in isolation for noninvasive assessment of localized disease Scheenen TWJ, et al. Investigative Radiology. March 2015.
3-dimensional T2-weighted imaging (contd…) • 3-dimensional T2-weighted imaging using prolonged spin echo trains with variable flip angle refocusing pulses has more recently been explored for prostate imaging in one study showing similar tumor detection as traditional multislice 2D approach • 3-dimensional T2-weighted imaging has potential to improve local staging as well as to reduce total scan times by avoiding need for separately imaging 3 orthogonal multislice 2D image data sets Scheenen TWJ, et al. Investigative Radiology. March 2015.
3-dimensional T2-weighted imaging • However, generally lower in-plane resolution, alterations in image contrast, as well as potentially increased motion artifact occurring during extended 3D acquisition have limited application of 3D T2-weighted imaging in clinical practice, such that standard 2D T2-weighted imaging remains mainstay for anatomic evaluation • It is possible that 3D T2-weighted imaging may prove useful for emerging MRI-targeted prostate interventions, such as MRI-ultrasound fusion biopsy & MRI-guided PCa ablation, although this remains an area for future investigation Scheenen TWJ, et al. Investigative Radiology. March 2015.
Diffusion-Weighted Imaging • Diffusion-weighted imaging (DWI) probes motion of protons during the time (Δ) between application of 2 pulsed field gradients (of duration δ) • Measurements of attenuation of MR signal during this interval are used to derive apparent diffusion coefficient (ADC) • Restrictions in freedom of movement of water molecules, imposed by cell density or differences in subcellular, cellular, or tissue structures, are origin of contrast in ADC images • Since 1st reports of cancer depiction in prostate using DWI, this technique has been subject of many studies over yrs, establishing its role in significantly improving cancer localization in prostate, such that sequence is now considered a crucial component of all clinical prostate MRI examinations Scheenen TWJ, et al. Investigative Radiology. March 2015.
Diffusion-Weighted Imaging • Diffusion-weighted imaging (DWI) probes motion of protons during the time (Δ) between application of 2 pulsed field gradients (of duration δ) • Measurements of attenuation of MR signal during this interval are used to derive apparent diffusion coefficient (ADC) • Restrictions in freedom of movement of water molecules, imposed by cell density or differences in subcellular, cellular, or tissue structures, are origin of contrast in ADC images • Since 1st reports of cancer depiction in prostate using DWI, this technique has been subject of many studies over yrs, establishing its role in significantly improving cancer localization in prostate, such that sequence is now considered a crucial component of all clinical prostate MRI examinations Scheenen TWJ, et al. Investigative Radiology. March 2015.
Diffusion-Weighted Imaging • There is continuing discussion regarding which and how many b values to use for acquiring DWI of the prostate & whether more sophisticated fitting models than a simple and readily available monoexponential decay curve to the data attenuation provides added value • In DWI acquired without diffusion gradients (b = 0), signal is present from spins flowing because of perfusion or blood flow • At b values greater than approximately 100 s/mm2, these signals are mostly attenuated, and only signal from diffusing water remains • Tissues with more restrictions to water motion, as occurs within PCa, retain signal at high (b > 1000 s/mm2) or even very high b values (b > 1500 s/mm2), such that inclusion of these high b values is particularly important for reliable tumor detection in prostate Scheenen TWJ, et al. Investigative Radiology. March 2015.
Diffusion-Weighted Imaging • New rapid or distortion-free DWI acquisition techniques have been recently described, including high SNR steady-state free precession image acquisition, reduced field-of view focused excitation echo planar imaging & readout segmented echo planar imaging techniques, although none of these have become widely applied in clinical practice at this time Scheenen TWJ, et al. Investigative Radiology. March 2015.
DWI of prostate; b values 50 s/mm2 (A), 500 s/mm2 (B) & 800 s/mm2 (C) showing bright signal in normal peripheral zone relative to CG. Signal of peripheral zone decrease with higher b values. ADC map shows bright signal in peripheral zone (D). In evaluating peripheral zone, ADC is most helpful in identifying foci of relative restricted diffusion to suggest cancer in the peripheral zone, which appears dark relative the background Yacoub JH, et al. RadiolClin N Am 52 (2014) 811–837.
Dynamic Contrast-Enhanced Imaging • Investigation of the use of dynamic contrast-enhanced (DCE) MRI in prostate predates that of DWI in the literature, although its exact role in providing additive diagnostic value continues to be debated • BPH is often hypervascular>> confounding assessment for hypervascularity in tumor • Essential difference between DWI, in which signal accumulation at different b value images can take several minutes & DCE-MRI is that in the latter, physiological dynamics of contrast agent washing in and out of prostate tissue define the temporal boundaries of signal acquisition • When contrast agent bolus is injected & reaches prostate, it moves rapidly from vascular to extravascular extracellular space Scheenen TWJ, et al. Investigative Radiology. March 2015.
Dynamic Contrast-Enhanced Imaging • Dynamic contrast enhanced MRI of prostate therefore requires high temporal resolution, typically at least 10 seconds if not faster, limiting achievable spatial resolution, but is hence usually not limited in SNR • There is a lack of consensus among centers regarding specific acquisition parameters • In addition, a multitude of post processing options & models are available to condense large volume of dynamic image series into few summary parametric perfusion maps. This variability has contributed to broad spectrum of approaches for interpreting DCE-MRI of prostate, ranging from qualitative radiological interpretation of time signal-intensity curve shape, through descriptive fits of this shape, up to advanced modeling of quantitative pharmacokinetic parameters with use of arterial input function Scheenen TWJ, et al. Investigative Radiology. March 2015.
Dynamic contrast enhancement analysis. Prostate cancer lesion is identified on a T2 TSE image (A) Yacoub JH, et al. RadiolClin N Am 52 (2014) 811–837.
Dynamic contrast enhancement analysis Yacoub JH, et al. RadiolClin N Am 52 (2014) 811–837.
Proton MR Spectroscopic Imaging (1H-MRSI) • Contrary to DCE-MRI & DWI, which started off being quite straightforward techniques with sophistication in post processing over the yrs, proton MR spectroscopic imaging (1H-MRSI) of prostate has always been considered to be technically more challenging • Detection of low signal of metabolites dissolved in water in organ surrounded by lipids requires considerable technical expertise & experience in acquisition, post-processing & interpretation to be successful Scheenen TWJ, et al. Investigative Radiology. March 2015.
Proton MR Spectroscopic Imaging (1H-MRSI) • However, technique is quantitative & reproducible and was able to distinguish cancer and noncancer tissue in a multicenter setting • Nonetheless, in another multi-center study, use of 1H-MRSI technique failed to observe any benefit at any of 8 sites to which technique was newly introduced, possibly owing to lack of clear definition of tumor focus size that needed to be localized & lack of validated quantitative analysis • Given relatively long acquisition time & considerable expertise required for 1H-MRSI, as well as more recent emergence of DWI, 1H-MRSI is helpful but not required sequence within standard prostate MRI protocols at this time Scheenen TWJ, et al. Investigative Radiology. March 2015.
Proton MR Spectroscopic Imaging (1H-MRSI) • If choosing to perform 1H-MRSI, then before calculating typical metabolite ratios as markers for cancer, it is important to fit spectral data with correct model shapes, as strongly coupled spin systems of citrate & spermine have different spectral appearances at different field strengths & pulse sequence timings • Acquisition techniques of 1H-MRSI are similar between 1.5 & 3 T • Recent technical developments include application of compressed sensing in conventional 1H-MRSI41 & J-resolved 1H-MRSI of prostate, which both still need to prove their potential in larger studies Scheenen TWJ, et al. Investigative Radiology. March 2015.
Proton MR Spectroscopic Imaging (1H-MRSI) • Small studies to quantify metabolite content rather than ratios by normalization to water as well as by short echo time 1H-MRSI44 illustrated difficulties in producing reliable data from complete gland • Introduction of adiabatic refocusing pulses in prostate 1H-MRSI45 as well as automatic placement of outer volume saturation slabs have potential to further decrease contaminating lipid signals in prostate spectra & could enable automation of data acquisition • If followed by automated post-processing pipeline, 1H-MRSI could provide reliable ratio maps to facilitate clinical interpretation Scheenen TWJ, et al. Investigative Radiology. March 2015.
Vast amount of information, images & number of parameters available in mpMRI examination of 55-yr-old patient with prostate cancer. Orthogonal T2-weighted images as anatomical reference, a matching axial histopathological slide with Gleason 3 + 3 tumor focus in the left peripheral zone and an apparent diffusion coefficient map. The cancer focus appears dark at ADC. Scheenen TWJ, et al. Investigative Radiology. March 2015.
4 measured DWI images (b = 0 to 800) & 2 calculated DWI images, in which tumor is bright Scheenen TWJ, et al. Investigative Radiology. March 2015.
3 semiquantitative pharmacokinetic parameters (initial area under enhancing curve, wash in & washout) & 3 calculated Tofts model parameters (Ktrans, Kep, and extracellular extravascular space) from DCE MRI Scheenen TWJ, et al. Investigative Radiology. March 2015.
2 1H-MRSI spectra from healthy & cancer tissues, metabolite maps from 3 metabolites of interest & metabolite ratio map, in which tumor stands out Scheenen TWJ, et al. Investigative Radiology. March 2015.
Peripheral zone hemorrhage. Axial T1 TSE (A) & precontrast axial T1 gradient echo (B) images show high signal in the peripheral zone consistent with postbiopsy hemorrhage, which limits evaluation of T2 TSE sequences (C) for prostate lesions. Small arrow indicates and incidental cyst in prostate Yacoub JH, et al. RadiolClin N Am 52 (2014) 811–837.
Peripheral zone lesion. Patient with PSA 6.2 ng/mL and prostate cancer on TRUS biopsy. Axial T2 TSE (A) and coronal T2 TSE (B) images show a well-defined T2 hypointense lesion in peripheral zone (arrow) with corresponding high signal on DWI (C) and low signal on the ADC map (D). Biopsy of this region was positive for Gleason 4 1 3 prostate cancer. Yacoub JH, et al. RadiolClin N Am 52 (2014) 811–837.
Hemorrhage exclusion sign. Axial T1 fat-suppressed image (A) shows hemorrhage exclusion sign where there is well-defined area of low signal intensity surrounded by areas of high signal intensity from hemorrhage (arrows). Areas of low signal intensity are from tumor surrounded by the high-signal blood. Axial T2-weighted image (B) shows low signal intensity from the tumor (arrow). ADC map (C) shows abnormal low signal intensity from restricted diffusion at the site of prostatic cancer (arrow). DCE-MR imaging color map (D) shows abnormal perfusion kinetics (arrow). Yacoub JH, et al. RadiolClin N Am 52 (2014) 811–837.
Prostatitis. Yacoub JH, et al. RadiolClin N Am 52 (2014) 811–837.
Extracapsular extension and neurovascular bundle invasion Yacoub JH, et al. RadiolClin N Am 52 (2014) 811–837.
Clinical value of prostate segmentation and volume determination on MRI in BPH • Currently, 2 most common modalities for prostate imaging & volume measurement: TRUS & MRI • Ellipsoid model: • Original & de facto standard method of calculating prostate volume, uses formula: transverse diameter×anteroposteriordiameter×length×0.52 & assumes that prostate has regular ellipsoid shape • This relatively quick & simple technique can be applied to both USG & MRI Garvey B, et al. DiagnIntervRadiol. 2014; 20: 229-233.
Ellipsoid prostate volume measurement on triplane axial (a), sagittal (b), coronal (c) T2-weighted MR images using the formula right-to-left (R-L) diameter×anteriorposterior (A-P) diameter×superior-inferior (S-I) diameter×0.52 Garvey B, et al. DiagnIntervRadiol. 2014; 20: 229-233.
Clinical case of patient with BPH on finasteride. Axial T2-weighted MR images show prostate gland at baseline volume of 99 mL (a) & after 1 yr on therapy, prostate volume was reduced to 89 mL (10% reduction) (c). 3D-reconstructed MR images generated from automated segmentation approach show whole gland (green) & transitional zone (red) at baseline (b) & after 1 yr on therapy (d) Garvey B, et al. DiagnIntervRadiol. 2014; 20: 229-233.
Magnetic Resonance Urography (MRU) • MRU: Evolving technology with potential to provide non-invasive “one-stop shop” comprehensive evaluation of upper urinary tract & surrounding structures without use of ionizing radiation • MR imaging offers inherently high soft-tissue contrast, is independent of excretory function & allows multiplanar imaging, without the need for ionizing radiation • MRI can demonstrate tumor involvement of renal parenchyma & perinephric tissues as well as detecting distant metastases • MR urographic techniques used to display urinary tract: static-fluid MRU (also known as T2-weighted MR urography) & excretory MRU (also known as T1-weighted MR urography) Moloney F, et al. Advances in Urology. Volume 2014, Article ID 414125, 9 pages.
Static-fluid MRU & Excretory MRU • Static-fluid MRU techniques: • Closely resemble those used for T2-weighted MR cholangiopancreatography & use heavily T2-weighted sequences to generate IVU-like images of urinary tract • Does not require excretion of contrast material & is therefore useful for demonstrating collecting system of obstructed, poorly excreting kidney • Excretory MR urography is roughly analogous to IVU (intravenous urography) & CTU (computed tomography urography) and uses gadolinium-enhanced T1-weighted sequences to depict urinary tract • Urinary tract calculi appear as filling defects on both static-fluid & excretory MR urography when surrounded by urine or contrast material Moloney F, et al. Advances in Urology. Volume 2014, Article ID 414125, 9 pages.