Download
1 / 47
470 likes | 474 Vues
This presentation explores the various weather and climate hazards in Hawaii and Taiwan, including heavy rainfall, drought, hurricanes, wildland fires, tornadoes, heat waves, cold surges, earthquakes, tsunamis, volcanoes, and landslides. The frequency, intensity, locations, and patterns of heavy rainfall events in Hawaii are examined, and risk-event maps are provided for local partners concerned with floods and relevant policy-making. The Generalized Extreme Value (GEV) distribution is used to determine the values of distribution parameters.

E N D
Weather and Climate Hazards in Hawaii and Taiwan Pao-Shin Chu Department of Meteorology University of Hawaii Honolulu, Hawaii, USA Presented at the Department of Atmospheric Sciences, National Central University 6/14/2011
An international workshop on natural disasters and mitigation to be held in Honolulu, Hawaii in March (?) 2012 • To be funded by the National Science Council through its LA Office
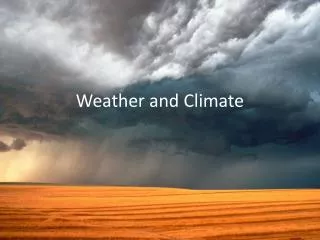
Heavy rainfall/flooding events, drought • Hurricanes • Wildland Fires • Tornadoes, hails, winter storms, heat waves, cold surges • Earth Quakes/Tsunamis, volcanoes, landslides
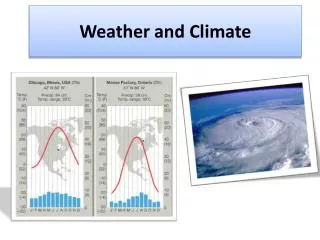
Long-term rainfall variations in Hawaii (HRI) Chu, P.-S., and H. Chen, 2005: Interannual and interdecadal variations in the Hawaiian Islands. Journal of Climate, 18, 4796-4813.
The HRI exhibits both a clear signal of interannual and interdecadal variations. • Rainfall is particularly low when El Niῆo occurred in the presence of positive PDO. • The band of anomalous surface westerlies to the north of Hawaii, and the deep sinking motion and the anomalously vertically integrated moisture flux divergence over Hawaii are all unfavorable for rainfall.
In the past, heavy rainfall events have resulted in major damage to properties, public infrastructure, agriculture, transportation, and tourism in Hawaii. • The 1987 New Year’s Eve flood on Oahu (a flood warning was NOT issued by the NWS until flooding had already commenced, affected densely populated urban areas) • 24-hr totals as high as 37 inches (>925 mm) on the Island of Hawaii in early Nov 2000 ($88 million damage).
12-hr values were 10 inches and rainfall rate was 5 inches per hour in upper Manoa Valley of Oahu in late October 2004 (Halloween flood) ($80 million damage for UH). • For 43 days between February and early April in 2006 (March Madness) Hawaii was battered by rain (Dam wall broke on Kauai and 7 people died) • Heavy rainfall and flood on Maui and Hawaii in December 2007 • Hilo flooding (early Feb 2008), Oahu flooding(December 2010)
March 2006 flooding on Oahu (March Madness?)
Three different methods are commonly used to define extreme rainfall events • Daily precipitation with amounts above 2 (4) inches is defined as a heavy (very heavy) event - Karl et al. BAMS, 1996; Groisman et al., Climatic Change, 1999 • Daily precipitation values associated with the 90th (99th) percentile of the distribution as a heavy (very heavy) event – Groisman et al., BAMS, 2001 • Annual maximum daily precipitation values associated with 1-yr (20-yr) return periods as a heavy (very heavy) event – Kunkel et al., J. Climate, 1999; Groisman et al., BAMS, 2001; Zwiers and Kharin, J. Climate, 1998
Kunkelfound that events that have a recurrence interval of 1-yr or longer have a high correlation with flooding in some U.S. regions. An n-yr event is often referred to as an event having a 1/n chance of occurring in a single year.
Objectives To understand the frequency, intensity, locations, and patterns of heavy rainfall events in Hawaii To provide updatedrisk-event maps which may benefit local partners (FEMA, state and county civil defense, NOAA, DLNR, BWS) who are concerned with floods and the relevant policy-making
Generalized Extreme Value (GEV) distribution Here there are three parameters: a location (or shift) parameter , a scale parameter , and a shape parameter .
How to determine values of the distribution parameters? • The method of maximum likelihood (ML) seeks to find values that maximize the likelihood function. However, it is not necessarily the best for finite sample sizes. • The method of L-moments is chosen because this method is computationally simpler than the method of ML and because L-moment estimators have better sampling properties than the method of ML with small samples (more robust). Hosking & Wallis, 1997; Zwiers & Kharin, 1998
As approaches zero, the GEV is reduced to the two-parameter Gumbel distribution. where is the average sampling frequency (usually as 1 yr-1). The return period R(x) associated with a quantile x is interpreted to be the average time between occurrence of events of that magnitude or greater.
Heavy rainfall/flood Heavy rainfall: daily rainfall > 2 inches Very heavy rainfall: daily rainfall >4 inches (NCDC)
Chu, P.-S., X. Zhao, Y. Ruan, and M. Grubbs, 2009: Extreme rainfall events in the Hawaiian Islands. J. Appl. Meteor. Climatol., 48, 502-516. • For estimating the statistics of return periods, the 3-parameter GEV distribution is fit using the method of L-moments. • Spatial patterns of heavy and very heavy rainfall events across the islands are mapped separately based on 3 methods. • Among all islands, the patternson the island of Hawaii is most distinguishable, with a sharp gradient from east to west. For other islands, extreme events tend to occur locally on the windward slopes.
Hawaii’s costliest natural disasters (Source: Hawaii Civil Defense, 2004) 1. Hurricane Iniki 9/11/1992 $2.6B, 4 dead 2. Hurricane Iwa 11/23/1982 $307M, 3 dead 3. Big Island flood 11/1/2000 $88.2M 4. Floods 1/6-14/1980 $42.5M 5. New Year’s flood 12/31/1987 $35M 6. Tsunami 5/22/1960 $26.5M, 61 dead 7. Tsunami 4/1/1946 $26M, 159 dead 8. Kilauea lava flow 1990 $21M 9. Floods 3/19-23/1991 $10 to 15M 10. Oahu flood 11/7/1996 $11M *Damage is not adjusted for the current value. A rough damage estimate of $80 million from the October 30, 2004 flooding in UH-Manoa would make it the fourth-costliest natural disasters in Hawaii history. Damage from March 2006 flood with a dam wall broke leading to 7 deaths??? Drought damage is not accounted for.
Hurricane Iniki in 1992: Destructive winds, torrential rain, and storm surges
Lihue, Kauai during Hurricane Iniki
Some applications of Bayesian analysis for tropical cyclone research • Change-point analysis for extreme events Zhao and Chu, 2010, J. Climate (Typhoons over WNP) Zhao and Chu, 2006, J. Climate (Hurricanes over ENP) Chu and Zhao, 2004, J. Climate (Hurricanes over CNP) • Tropical cyclone prediction Poisson regression model Chu and Zhao, 2007,J. Climate (CNP) Lu, Chu, and Chen, 2010, Wea. Forecasting (Taiwan) Chu et al., 2010, J. Climate (Taiwan) • Clustering of typhoon tracksin the WNP Chu et al., 2010, Regional typhoon activity as revealed by track patterns and climate change, in Hurricanes and Climate Change, Elsner et al., Eds., Springer
Why Bayesian inference? • A rigorous way to make probability statements about the parameters of interest. Probability is the mathematical language of uncertainty. • An ability to update these statements as new information is received. • Recognition that parameters are changing over time rather than forever fixed.
An efficient way to provide a coherent and rational framework for reducing uncertainties by incorporating diverse information sources (e.g., subjective beliefs, historical records, model simulations). An example: annual rates of US hurricanes (Elsner and Bossak, 2002) • Uncertainty modeling and learning from data (Berliner, 2003)
Change-point analysis for tropical cyclones • Given the Poisson intensity parameter (i.e., the mean seasonal TC rates), the probability mass function (PMF) of h tropical cyclones occurring in T years is • where and , . The λ is regarded as a random variable, not a constant.
Gamma density is known as a conjugate prior and posterior for λ. A functional choice for λ is a gamma distribution • where λ>0, h´ >0, T´>0. h´ and T´ are prior parameters.
A hierarchical Bayesian tropical cyclone model adapted from Elsner and Jagger (2004)
Hypothesis model for change-point analysis (Consider 3 hypo.) H0 H1 H2
•An abrupt shift in the typhoon counts near Taiwan occurs in 2000 based on the Bayesian change-point analysis, and this change is consistent with a northward shift of the typhoon tracks over the WNP-EA region. Tu, Chou, and Chu, 2009: Abrupt shift of typhoon activity in the vicinity of Taiwan and its association with the Western North Pacific-East Asian climate change. J. Climate, 22, 3617-3628.