Download

1 / 16
160 likes | 333 Vues
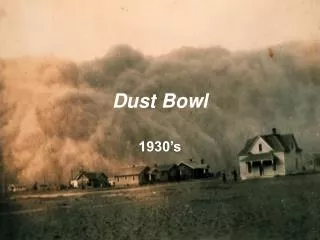
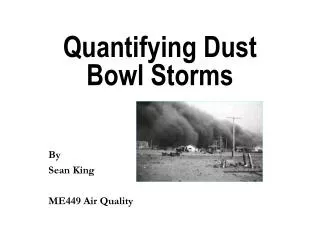
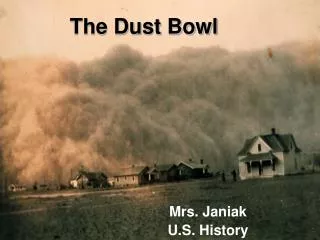
Quantifying Dust Bowl Storms. By Sean King ME449 Air Quality. Table of Contents. Introduction Why was there a dust bowl? Maps of the Dust Bowl Storms How did the dust bowl end? Conclusion. Introduction.

E N D
Quantifying Dust Bowl Storms By Sean King ME449 Air Quality
Table of Contents • Introduction • Why was there a dust bowl? • Maps of the Dust Bowl Storms • How did the dust bowl end? • Conclusion
Introduction • The object of this study to to locate and quantify dust storms that occurred during the ‘dust bowl’ period of the 1930’s • Dust storm information was extracted form articles in the Monthly Weather Review. The severity of the storms was objectively determined and applied to the data. • This report will breakdown the individual storms from 1936 to 1939 and give their location and severity. • Reasons why the dust bowl came about • Pictures of dust bowl storm distribution • How did the dustbowl end?
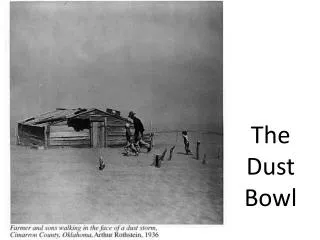
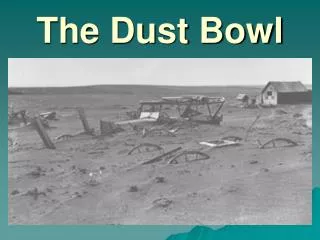
Causes for the dust bowl • In the late 19thcentuaury , the population of the southern plains exploded due to new settlers, most farmers • From 1879 to 1887, phenomenally heavy rains fell on a patch of the High Plains from Texas to Canada. This gave false impressions of the usual rainfall in the region to the new settlers. • Crop production shifted from a variety of crops, used as fallbacks if one failed to predominantly wheat production • Farming took over land once considered sufficient only for grazing of livestock • The appearance of modern mechanical farm equipment encouraged farmers to plow up more land and to plant on acreage that was otherwise unusable • Not recognizing the problems of initiating massive agricultural programs meant farmers had no contingency plans when the drought hit. • Repeated drought and farming of marginally productive acreage was intensified by a lack of soil conservation methods
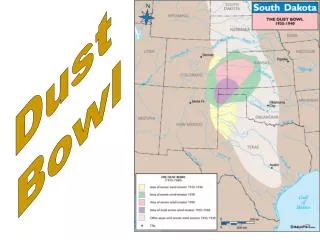
Maps of the dust storms Dust Storms 1935-1938
Maps of the dust storms Dust Storms of 1939
Maps of the dust storms Large Area Dust Storms for 36-39 Not included are the dust storms in the Southern Great Plains on the level of 5.
Maps -Explination • In the years 1936 to 1938 there was a fairly scattered distribution of dust storms around the midwest, with a few outliers in the northeast and northwest. • 1939 brough about a greater number and more sever storms. • The storms in 1939 that were in the same areas that there had been in the previous 3 years saw increased dust activity. • New locations experienced dust activity, some fairly severe storms. Most of these new locations were in Texas and Oklahoma. • The slide of the state storms gives a general idea which states had the most widely affected areas. • The data set that was used to plot this data can be found here.
Maps - Explination • Note that the center of the frequency distribution of the dust storms moves slightly to the north from March through May. • Also note that in June there was more than one center of peak dust activity, as the frequency overall increases. • Also in June the absolute maximum of dust activity frequency occurred in North Dakota, instead of in the Southern Plains, indicating that there is more than one specific region affected by the dust storms.
Maps depicting Frequency and Severity of Dust Activity in March 1936 Note that the most frequent dust activity occurs at areas are at the edge of the most severe section for the storms for the month
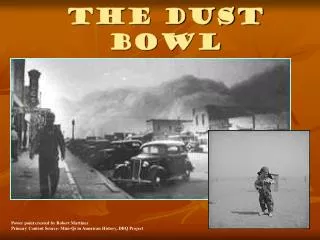
Description of a storm • Details describing a trip from Dodge City, KS to various spots in the dust bowl, February 17, 1937, by a weather bureau officer. • Before 6am, light dust was blowing through Dodge City, with visibility a little over a mile. • Light dust was present on the way to Liberal, KS, where at 10 miles out, dense dust was encountered. This brought visibility down between 15 and 20 feet. • Staying on the road was difficult. After over an hour, the 10 miles were covered. • Next stop Hooker, OK, while heavy blowing of dust was still present. • Frequent stops were needed along the way because visibility was reduced to near zero for periods. • Three hours and forty five minutes were needed to drive the 23 miles between towns. • Drifts several feet high were noted along the way. • Finely powered dust was everywhere. • More deserted farmhouses were passed than inhabited ones.
How it was resolved • New Deal relief and conservation programs • Government Agencies helped out • The Southwest Agricultural Association [SAA] • Federal Surplus Relief Corporation [FSRC] • New Soil conservation practices • Chisel plowing: digging deep into the soil and leaving large chunks of dirt intact, the ground itself could perform as a windbreak • Lister plowing, where gullies were cut deep for windbreaks • Planting of hardy plants like Kaffir and Sudan grass • Spreading the sand out in thin patches to allow the wind to redeposit it.
Conclusion • Rapid population growth, increase in land farmed, new farming practices, and the uniform wheat crop dried out the soil in the American Southern Great Plains. • The great dust storms and the dust bowl mainly affected the south central portion of the United States, predominately the Texas panhandle, parts of Oklahoma, Colorado, and New Mexico. • Seasonality of dust storms seems to be centered around the spring and summer months. • Through the farmers conservation efforts and federal relief programs that helped them along, the dust bowl was finally brought under control
Sources • For latitude and longitude positions: http://www.bcca.org/misc/qiblih/latlong_us.html • http://www.digital-neighbor.com • Dustbowl history • http://freespace.virgin.net/john.cletheroe/usa_can/usa/dbowl2.htm • http://www.mindspring.com/~jwar/dust/dirty.htm • http://www.swosu.edu/~bryantr/1614/ppt/c6pt1/sld001.htm • http://www.ptsi.net/user/museum/dustbowl.html • CAPITA Dustbowl Files • R. J. Martin, “Duststorms of February and March 1936 in the United States” The Monthly Weather Review, p87-88, April 1936 • R. J. Martin, “Duststorms in the United States, April 1936” The Monthly Weather Review, p137, April 1936
Sources • R. J. Martin, “Duststorms of May 1936 in the United State” The Monthly Weather Review, p176, May 1936 • R. J. Martin, “Duststorms of August-December 1936 in the United States” The Monthly Weather Review, p429, December 1936 • R. J. Martin, “Duststorms of January-April 1937 in the United States” The Monthly Weather Review, p151-152, April 1937 • R. J. Martin, “Duststorms of 1938 in the United States” The Monthly Weather Review, p12-15, January 1939 • R. J. Martin, “Duststorms of 1939 in the United States” The Monthly Weather Review, p446-451, February 1940 • J. P. Kohler, “Duststorms in the United States, June 1936” The Monthly Weather Review, p206, June 1936 • H.F. Choun, “Duststorms in the Southwestern Plains Area” The Monthly Weather Review, p195, June 1936 • Pictures provided by www.discovery.com