Download
1 / 8
80 likes | 200 Vues
Explore the history, causes, and aftermath of the Dust Bowl storms from the late 19th century, including maps and solutions. Learn how conservation efforts and legislative bills helped resolve this environmental crisis. Discover the impact of modern farming equipment on the environment. 8 Relevant

E N D
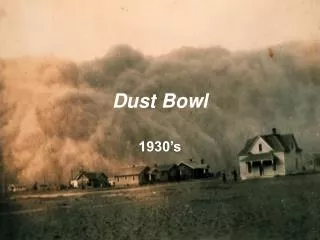
Quantifying Dust Bowl Storms By Sean King ME449 Air Quality
Table of Contents • Introduction • Topic 1 &2 • Topic 3 • Maps • Conclusion/Summary
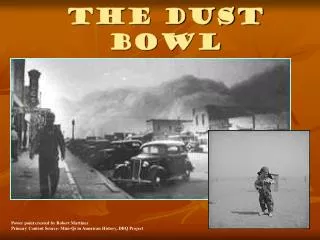
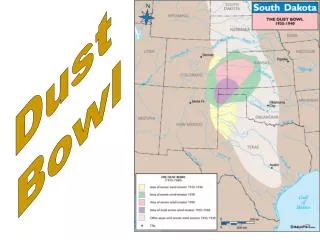
Background/Introduction • Objective of the project (the 1 liner) • why us my part important • statement of methods • what is in the report • how bowl came about • picures of dust bowl storm distribution • how it was fixed
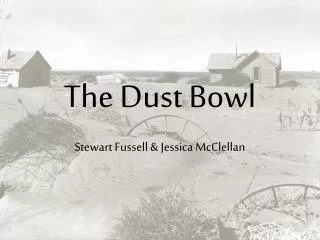
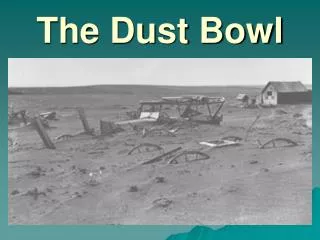
Causes for the dust bowl • Clean up • In the lat 19thC, the population of the southern plains exploded due to new settlers, most farmers • Repeated drought and farming of marginally productive acreage was intensified by a lack of soil conservation methods • Not recognizing the problems of initiating massive agricultural programs meant farmers had no contingency plans when the drought hit. • Farming was introduced on land once considered sufficient only for grazing of livestock • (1879-1887) when phenomenally heavy rains fell on a patch of the High Plains from Texas to Canada • Crop production shifted from a variety of crops, used as fallbacks if one failed to predominantly wheat • The appearance of modern mechanical farm equipment encouraged farmers to plow up more land and to plant on acreage that was otherwise unuseable
How it was resolved • Conservation • bills • rain
What This Means • Add a strong statement that summarizes how you feel or think about this topic • Summarize key points you want your audience to remember